Saturday, November 28, 2020


I have a dream ….

After all these years of trading and going through the “coulda-should-woulda” experiences, while working fully time in Management, I realize that the technical knowledge I learned with trading is a strength of mine and will prevent me from losing big. Risk and reward are inexorably tied together. If you want to make big money, then you have to take bigger chances in the market. I hear of the Robin Hooders who made it big. Yes, they can. And if luck is on their side and they have the guts for it, they certainly have done so, or they have busted their accounts attempting to do so. Many of the big and quick money trades are using short term weekly options trades on the big $$$ stocks such as TSLA and AMZN and riding the trade to big money if they were correct on direction. For TSLA and the FANG stocks, it has mostly been trade long using call options.

Yes, I have a dream. It is to make it big; but I am unwilling to take such big risks. That makes the end goal somewhat unlikely I will admit, since risk and reward are tied.

My plan is straightforward… stick to one thing and not give up on it while I do my other daily end-of-day trades and while I work full time. I plan to keep working on being a successful Nasdaq futures trader. My first step is to trade /MNQ micro mini Nasdaq 100 futures with my Roth IRA account. I expect to make $50-$100 on a good day. That certainly won’t make me a quick Millionaire!
But after I feel comfortable that I have a winning system and can successfully grow my account, I will move up to /NQ Nasdaq e-mini futures. That moves quickly and even with one contract, you can win or lose a $1,000 in less than ½ an hour… you don’t want to walk into that buzz saw without total confidence in the system that you plan to trade…

There are an even bigger money-making choices open to you if you can truly be the 1-3% of the people who can master making money on the /NQ … by trading short term weekly options on it. These weekly options are expensive as the Nasdaq is sitting a- t 12,273. Now you are talking of moving many more multiples of money in ½ hour.

Question is
1. Do I have a good system?
2. How much loss can I handle before I can’t take the losses?

One step at a time for me… and my first step is to make sure my brain knows my winning system really well, so that when the system and I incur losses, I do not step away from the system. It is like touching a hot stove, and your brain is saying don’t go back and touch it. But you have to if you want the reward… and that is what day trading is really like. With Nasdaq futures, the market is open almost 24 hours, although there are good times and bad times to be trading. Big money to be made…

/NQ at Friday's closing ...


Sunday, June 18, 2017

401K versus Roth IRA - which is better?

An associate at work asked me which is better; saving in a tax-deferred 401K or a Roth IRA where your disbursements are tax-free? His young nephew had asked him the question. While both have their positives, I will say that bulk of my savings is in 401Ks and some that are transferred from a 401K into a Rollover IRA in brokerage accounts. Most of that was a result of my not being aware of a Roth IRA till much later. But would I have changed anything? And recently why did I start a Roth IRA?

The main advantages of a 401K are:
1. You can contribute money directly from your paycheck and if you don’t see the money, it is easier to save it.
2. It is taken out as pre-tax dollars and reduces your tax obligations year end.
3. Companies usually offer a partial match up to 3-5% of your contribution. That is free money one should take.
4. 401K being pre-tax dollars compared to a Roth IRA being post-tax dollars, a larger amount of seed money will multiply and grow much faster than a smaller amount.
5. The contribution limits for a 401K are $18,000 if you are below 50 with additional $6,000 catch up contribution if you are 50 or older. The contribution limit for Roth IRA is $5,500 and for 50 and over $6,500. Additionally you can also contribute to a spousal IRA if your spouse is not earning.
6. Finally, when it comes time to withdraw the 401K money in retirement, most of us will have less income for tax purposes and our tax rates will be smaller than when we were earning money. This is an advantage for a 401K versus Roth IRA.

So why put any money into a Roth IRA?
1. So why did I start a Roth IRA? I plan to day trade futures after I retire. I believe I can take a small amount of capital - as little as $13,000 and generate a $20,000 profit on it. By setting up a Roth IRA, I plan to make this money tax-free.
2. There is no harm in having both 401K and Roth IRA accounts.

The clear winner seems to me 401K. Feel free to comment on this blog post if you agree or disagree but this is how I see it!

Sunday, December 18, 2016

401K Monthly Analysis – Hacked! 12/17/16

Our home PCs were hacked, network compromised. That has been the reason I have been unable to post previously. The timing could not have been any worse. The hacker wiped out all the data and program files on my laptop. Metastock was not very cooperative. The technical people pointed me towards sales. The sales person said he was very busy with the sales calls due to Christmas and would call back… not really. And I am doing contract work in a different State than we live in so I had to leave my laptop at home and stay out of the markets while it roared upwards after the elections… this is one part of trading’s mental things… the regret for not participating in a run up that your system would be telling you to go into. Currently I have signed up for a VPN service for protection. I am writing this blog from a hotel using the VPN. As I write this I cannot help but think that Cyber attack is very powerful and can be extremely painful..

Back to the blog…

The S&P500 (SPY) chart points up based on my trading system. So is the Dow Jones 30. See charts for SPY and DIA.  The ETF for the Dow Jones 30 is DIA. The US Dollar is showing strength with the Fed’s interest rate increase. Gold funds are down. The chart on the GLD ETF is falling hard and so are Bond funds – see chart on FGOVX.


Going into one of my previous company’s 401K the top funds selected by my monthly analysis are Royce Opportunity, Fidelity Equity Income, Fidelity Freedom 2050 fund, Spartan 500 fund. Fidelity Govt Income Fund took a big hit. Royce Opportunity requires a long stay in the fund due to the redemption fee for getting out early. More in my next post.


Saturday, October 1, 2016

401K Monthly Analysis – No change 100116

“My daily SPY analysis shows a down signal. Chart attached. This is using a custom trading system generated by ICE software for Metastock and using my preferences to customize it. The signal is leading and depends on the indicators selected. All trend following systems are lagging price. If we have profited from the last move up in the markets, this may be a time to pare down and get protective if you are cautious like me. “
-        This part of the blog from previously remains unchanged… On the chart for SPY (see below) I have circled 4 areas. These are times when the red 50 day EMA (Exponential moving average) turned flat/horizontal. Markets don’t stay flat forever and the inevitable outcome is a strong up or down move. The two red ellipses were down moves and the last green ellipse was an up move. There is a good chance that the markets could take off upward with a Hillary Clinton win, as the uncertainty would be gone. I think the Mexican Pesos would also stabilize. With a Trump win there will be more uncertainty and we know the markets roil against uncertainty as well as protectionism… In effect we are now sideways looking for an up or down direction…which does not help in our trading/investing/gambling… I call it trading.

“With my previous employer’s 401K funds, the top funds from the monthly analysis are Royce Opportunity, Fidelity Equity Income, Fidelity Blue Chip Growth and Spartan 500 fund (same as SPY). Royce is actually at the top but it is very volatile, and also has a short term trading redemption fee in case we want to get out within a month. Royce has recovered from its low of $8.46 price to $11.55 now. Considering it was at over $16, it moves around a lot. It is better to invest in Royce when all the stars are aligned as it can drop quickly. The FGOVX that I am still in is going nowhere. Still has an up signal on the weekly chart. “
-        This part of my blog from last month also remains completely the same… rather unusual…   

“I have put in a trade on ITRI at the recent secondary buy signal. Also closed out a nice trade on SHOP in my R/IRA. I hold TLT as a hedge against these trades. Currently I am in FB and MTCH, social media stocks. I have also started taking some longer term put positions on the Q’s in case the market tanks in the Fall before the elections.”

-        Update: I closed my ITRI trade for a handsome (15%) profit just as I did for SHOP previously. I sold FB at a small (3%) loss when I had a down signal but remain in MTCH which has gone up over 15%. I have added MDT stock which is slightly (2%) down from when I bought it. I will continue to hold TLT and my put options as a hedge. I am cautious. I believe the markets will go up but will tip toe in as the other side of the coin is a rapid 10-15% move down..


Monday, September 5, 2016

401K Monthly Analysis – A Down Signal? 9316

My daily SPY analysis shows a down signal. Chart attached. This is using a custom trading system generated by ICE software for Metastock and using my preferences to customize it. The signal is leading and depends on the indicators selected. All trend following systems are lagging price. If we have profited from the last move up in the markets, this may be a time to pare down and get protective if you are cautious like me.

With my previous employer’s 401K funds, the top funds from the monthly analysis are Royce Opportunity, Fidelity Equity Income, Fidelity Blue Chip Growth and Spartan 500 fund (same as SPY). Royce is actually at the top but it is very volatile, and also has a short term trading redemption fee in case we want to get out within a month. Royce has recovered from its low of $8.46 price to $11.55 now. Considering it was at over $16, it moves around a lot. It is better to invest in Royce when all the stars are aligned as it can drop quickly. The FGOVX that I am still in is going nowhere. Still has an up signal on the weekly chart.  
I have not started analyzing my current employer’s 401K funds but I will soon as I am aggressively saving there…

I have put in a trade on ITRI at the recent secondary buy signal. Also closed out a nice trade on SHOP in my R/IRA. Credit goes to Motley Fool for the pick...I hold TLT as a hedge against these trades. Currently I am in FB and MTCH, social media stocks. I have also started taking some longer term put positions on the Q’s in case the market tanks in the Fall before the elections.


Sunday, August 7, 2016

401K Monthly Analysis - Higher 8716

The market continues to ignore any disappointing news and head on higher. Brexit gave us a reason to pause but we are over that it seems. SPY is pointed up. So is QQQ and the Diamonds (DIA) Dow Jones 30. See charts below on SPY and QQQ. The market is not concerned with the US elections. I suspect that is because the outcome is likely less uncertain based on recent polling.

My previous employer’s monthly analysis shows that the top funds to be in are Royce Opportunities, Fidelity Blue Chip Fund, Spartan 500 and Fidelity Income fund. Royce is a very volatile fund and has a short term redemption fee charged if you get it and get out in a month. It is fund that you have to commit leaving money into.

I am ready to start my next experiment in trading. I have been trialing my automated trading program (Bandit) with real-time data and simulation money on a VPS and the performance over a year has been very positive. It is now time to turn on the real thing. I will not be looking over my shoulder at it… it will be running on its own with a stop loss and take profit levels for about 2 ½ hours each day in the morning trading Nasdaq futures… Let us see how well real-time performance does vs forward simulation. 


Monday, July 4, 2016

401K Monthly Analysis – Summer Rally or Not 7/4/16

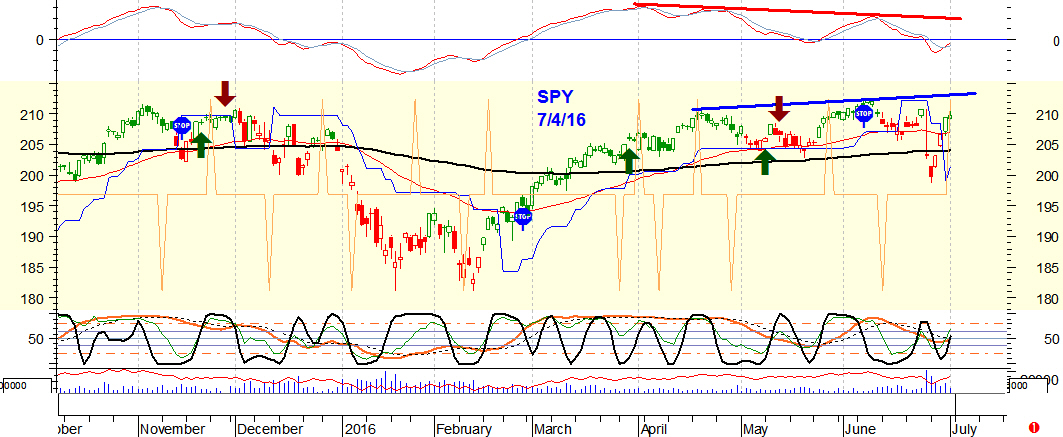
My daily SPY analysis shows an exit down signal; which I interpret as Up; but the market has been trading sideways for a while. The resolution to the sideways move will either be up or down. With Brexit, we saw volatility spike and then quietly ebb away. Fade the down move the market said. So here we are again at a sideways situation. What can I squeeze out of the charts for clues? And what are they telling us right now?

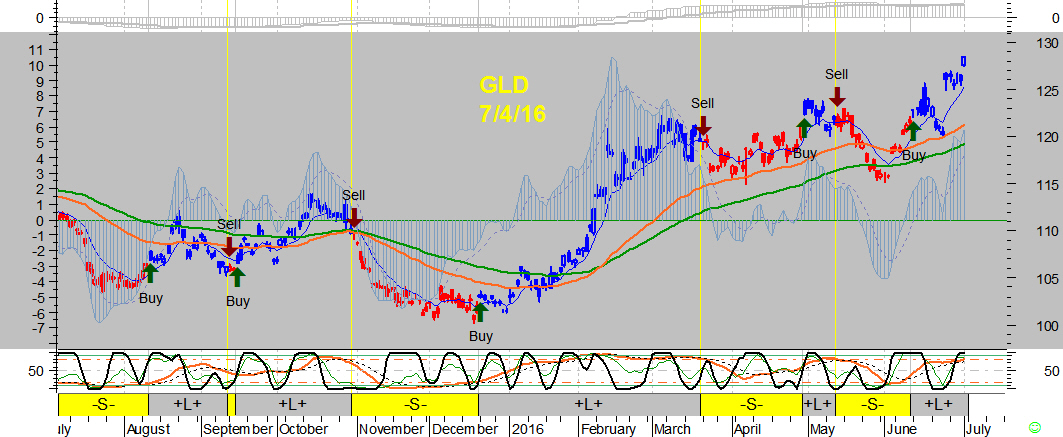
Gold has been steadily moving up. I have to believe that based on the chart for GLD shown below. NUGT, the Gold Miner’s ETF has gone nuts. Over the last few months it has moved up from the 20s to 144. Talk about a big move…  And the bond funds have also gone up. See chart for TLT, 20 year Treasury bond fund ETF, below. And stocks? Well they are also holding their own. But something has to give. We can’t have Gold, bond funds and stock funds all harmoniously going up. They don’t like each other…Which will give ground?

Looking at the chart for SPY I see a slight divergence between the indicator peaks, (red line) and the SPY’s peaks (blue line). SPY has gone up but not convincingly. So here I go again. I will be cautious and stay on the side lines. If we breakout then the market will rip and I will be crying about missing the Summer rally for sure!

With my previous employer’s 401K funds, the top funds from the monthly analysis are Spartan 500 fund (same as SPY), Fidelity Equity Income and Fidelity Growth Strategies. Royce is actually at the top but it is very volatile, and also has a short term trading redemption fee in case I want to get out within a month.  

I have not started downloading and analyzing my current employer’s 401K funds. But I will next month. I am putting as much money as I can into my 401K every month; all into a docile fund. 


Sunday, June 5, 2016

401K Monthly Analysis – SPY Conflicts 6316

The S&P500 (SPY) points down. Attached below is a chart of SPY showing the down signal. My slower monthly 401K system has switched from Bond funds like Fidelity Govt fund and is showing entries into equity. What do I do? I decided a while back that I will follow my overall master switch (SPY) and use that to override any 401K picks in the equity arena. That means I will exit my Fidelity Govt funds and stay in money market for now.

Going into my previous company’s 401K the top funds selected by my monthly analysis are Royce Opportunity, Fidelity Equity Income and Spartan 500 fund, which are all equity type funds. But since my choices are governed by the SPY exit signal, I am just going to remain in a money market fund for now.

I am invested in a couple of equities, oil and another ETF. I will follow the technical signals on those separately. When there is an exit signal on oil, I will get out. I have also seen an entry signal in EEM Emerging Markets and IIF India Fund. I have taken a small position in the India fund. The overall equity markets seems to want to go up. But it is burdened by the possibility of a slowdown and soft earnings. Technical signals is the beacon that I follow.


Monday, May 30, 2016

A Case for Oil vs Gold 52916

Which is stronger right now? Oil or Gold?
I have put some money in Oil. Not Gold. Looking at the charts, I see a down signal on GLD. Also Gold Miners ETF NUGT has taken a big hit lately dropping from over $100 to $70. Being a leveraged ETF it moves quickly, up or down.

The ETF I have purchased for oil is USL. Currently it has worked off a bottom and has slowly been on an incline upwards. See chart below on USL. Fundamentalists will provide the reasons why. We have both a major and minor signal pointing up. Summer months and more travel and higher oil consumption? If the market’s mood changes I will be quick to exit. I would rather see my account creep upwards at a slow pace than hold and pray over the next 5 years while it takes a beating. That is my conservative mind set.

OIL (USL) CHART


 GOLD (GLD) CHART


Additionally I have a buy signal on QQQ and DIA. That means a buy signal on the Nasdaq 100 ETF and the Dow Jones 30 ETF. My cautious play with that is to sell some QQQ vertical put spreads with a delta of around 40 and with a near month expiration. My plan is to hold it for a couple more weeks with the expectations that it will go sideways or up, and I would keep the credit premium. The max gain and loss on this transaction is capped. It is also a cautious play.

QQQ CHART


I am also seeing a buy signal on EEM (Emerging Markets ETF) and on IIF, the India Fund. Think I will put in for a small buy on the IIF. It can move up quite rapidly. But if it goes down, then I will follow the exit signal and take a small loss. It seems a safer play to buy IIF with a corresponding buy signal on EEM… no guarantees though!

Sunday, May 8, 2016

401K Monthly Analysis – Sell in May and… 5/8/16

It is May again and the old proverb “Sell in May and Go Away” comes to mind. But will that be the right move?

When I did my monthly analysis on my previous employer’s 401K where I have funds in, the top choice was to stay in Fidelity Govt Income Fund. I am currently 20% invested in that and rest is money market. I am cautious on my investing and see no point in taking unnecessary risks right now. The market is pretty murky and one cannot clearly see the bottom. See my chart below on DIA (Dow Jones 30 ETF). It shows a divergence in price versus the indicator above it.  See the orange line sloping down off the indicator’s last two peaks while the green line off the price peaks is sloping upwards. That suggests that although price is rising, this is not a strong move.


The latest jobs report was tepid. To me that is actually good. I would rather see slow growth than a rapid one and us reaching full employment rapidly and interest rates rising. As it is we are at 5% unemployment which is historically a low number. It is certainly a lot lower than 7 years back when we had 10% unemployment and jobs were tanking. China showed lower exports and imports - shrinking. And my emerging markets chart (EEM) has fired off a down signal. See chart below.


The US dollar actually dropped below its support level. And what has been rising lately is Gold. See chart below on GLD. What has been rising very, very rapidly is the 3xleveraged Gold Miners ETF fund… NUGT. I will write about that in my next blog.
Meanwhile I will look at cautious trades such as selling vertical call spreads on market ETFs such as DIA..


Sunday, April 10, 2016

401 Monthly Analysis – Confusion! 4816

The monthly analysis on my two 401K funds continues to show a cautionary outlook as it abandons stock funds. Meanwhile my ICE system on SPY shows an up signal which suggests an up signal on stock funds. This is a cautionary tale as the monthly analysis has not turned to stock funds yet. Investing in bond funds usually means that we are expecting bonds to rise as investors take flight from stocks.

I have just started putting money into my new current company’s 401K and have not yet started any analysis. Based on my previous company’s 401K monthly analysis the Fidelity GOVT Income Fund is at the top of the list. I will increase my holdings in that fund. In a past 401K company holdings I have, the PIMCO GL BD ADM fund and PIMCO REAL RETN ADMN funds are at the top. They are both bond funds. The Realty fund is next in line and has also shown strength.


Confusing tale on the tape = Caution = Stay in Bond funds… 


Sunday, March 13, 2016

401K Monthly Analysis – Change in Signal 31216

401K Monthly Analysis – Change in Signal 31216

My monthly analysis is a week late. This is mainly because we moved across the country with a new job and I have had numerous problems with the internet and my personal laptop. And although this is my personal blog on investing, I would still like to be consistent in posting the 401K Monthly analysis during the first weekend of a new month.

The S&P 500 has given an exit short signal a few days back. That means we can get back into our 401K funds if we wish to. I will be soon starting a new 401K plan with my current company. The chart on SPY represents where the overall market is and shows that for now we have seen a short term bottom.

In my past employer’s 401K funds the strongest funds to put money into are the Spartan 500 fund, the Fidelity Fund and Fidelity Growth Strategies. Attached below are charts on the Spartan 500 and Fidelity Growth Strategies. I am still cautious and will only invest a portion of my funds into these and/or try to time my entries after a pull back.


Recently I had good success with short term trading NUGT using end-of-day data and buying and selling using market limit orders. It is a leveraged Gold Miner's fund that moves very quickly, so one has to really pay attention to the technicals. 


Tuesday, February 9, 2016

401K Monthly Analysis – All Bond funds 2816

The market remains in a downward position; but looking at the chart below on SPY, I see that support is still holding. Support is the red horizontal line. In fact the slow stochastics is showing an upward tilt. However price is still below the blue line so our posture should be to look for trades on the down side. See chart on SPY below.

Interestingly the monthly 401K funds are decidedly negative. This is demonstrated by my last employer’s 401K fund choices where the preference is only to be in FGOVX which is the Fidelity Govt Income Fund, a bond fund. See chart on FGOVX below. No other fund choices are recommended!

And in the 401K choices for another employer I was with, the only two funds recommended are FGOVX and PIMCO GL BD ADM. None of the stock funds are positive. So we sit and wait. No hurry to rush in.

I did dip my toes into the NUGT leveraged gold miner’s fund at around $25 and got out this week at $37. Nice tidy profit in a week. But caution – this ETF will move fast and can smack you. Today it dropped 11%. See chart below.

I have recently changed employer and taken a new job. What used to be my current employer's 401K funds has now become my last employer. And the employer before that I refer to as another employer. I cannot wait to start another 401K with my new, current employer.


Sunday, January 17, 2016

401K Monthly Analysis – What a start to 2016!

My posting has been a week late as I have moved to California with a job change. It has been busy, hectic for me and has left our whole family with a feeling of being displaced (which we have been!). It will take some time to settle down. We are still in a temporary rental. It took a week to just get Time Warner Cable to come and give us internet and cable. But the market waits for no one and it started this year with a bang. My chart on SPY gave an exit signal back in 11/27/15 and I have to say that I have been out of the markets as I am very conservative. The advice for a more aggressive investor would be to follow the monthly choices but even that has shown weakness finally and the signal is exit.

In my current employer’s 401K choices, the word is nothing looks positive so it is time to exit. It is unbelievable how fast the market has dropped. It is also at a place of support and if it penetrates through that support level then we have a lot further to go. Normally I would expect a bounce before the drop. As for me, I am staying out and will not dip my toe in.

In my previous employer’s 401K choices I see the same. Everything looks negative on the monthly analysis. That does not happen too often. Best to exit and stay out.


Oil has been crashing and now with Iran coming on stream shortly, the world will be flooded with more oil. No one is willing to cut back production. OPEC is neutralized. The Saudis and Iranians are in serious dispute and very upset with each other over the shooting of a cleric. The Pakistani Prime Minister is hopping between the two countries to ease tension. Never have I seen that before. Russia and the Ruble is down. So is the Canadian currency with oil sliding… what a start to 2016!


Sunday, December 6, 2015

401K Monthly Analysis 12/17/15

The market is again at a crucial juncture. It wants to climb higher but the pressure of daily and weekly resistance is against its doing so. My daily and weekly time frame charts on SPY both show downward signals. See the charts below…That is really quite unusual. I am sitting on the side lines right now. I had dipped my toes in for a put option position on SPY but quickly exited with a small profit after the market went down and rushed up on Friday.

In my previous employer’s 401K, the recommendations are to be in Cohen & Steers Realty fund, Fidelity Contra fund and American Century Income Instl. Vanguard Instl Index is also a valid choice after these three.

In my current employer’s 401K the fund choices are Spartan 500 and Fidelity Growth. That means the third choice would be cash or money market.


Sunday, November 15, 2015

France attacked by ISIS 11/15/15

France experienced an attack by ISIS. I am sorry to hear about those that were killed and their families for the loss of loved ones and the many injured people. Their lives changed. Terrorism adds another layer of uncertainty to the markets. After approaching the highs, the market is withdrawing and I am seeing sell signals. I am out of the market with the exception of a position in a bond fund using the Ivy Portfolio strategy. Also I am still in the vertical calls I had sold on the Nasdaq100 QQQ. That expires in December so I will hold it for a little longer to get more time decay before exiting. Both these positions do better when the market goes down.

SPY has an exit long signal so those that want to preserve capital will want to exit now. Stochastic is bottoming out so it is likely to see a bounce after the recent drops. Although with a terrorist attack, people may not be in a mood to go long. I suppose the computer programs running on algorithms really don’t care.


See chart below on S&P500 (SPY) now has an exit long signal. I usually use it to exit my 401K positions; but since I did not go long in the first place, no changes are needed for me. 


Sunday, November 8, 2015

401K Monthly Analysis – Clawing back 11/6/15

The market has clawed its way back to almost its highs. See the chart below on the Spartan 500 fund. It is the only entry open in my current employer’s choices as most of the others are still flashing caution. Emerging markets are very weak. In this environment we would expect bond funds to strengthen but bond funds are retreating at the threat of increasing interest rates. The market is in a quandary as to how to react to the real possibility of a fed interest rate hike in time for Christmas. Unemployment numbers are at its lowest it has been in many years. The US dollar is strengthening at the possibility of higher interest rates, causing oil to remain low. That and the glut in oil supply and that China may be hitting a plateau. We could get a nice Santa rally. I am still cautious and although I should be in the markets, am taking some time out.

In my previous employer’s 401K funds the top choices are Fidelity Contra fund, Fidelity Mt Vernon Growth and Artisan Mid Cap Fund.

In my current employer’s 401K the fund choice is Spartan 500 Fund. Chart below. I would say stay part cash with the rest as there is still plenty of signs that the trend may be tiring. 

See the chart below on the Spartan 500 fund. It is a snapshot over 7 years and shows how the trend has held long for quite some time without a serious draw down, or recession. And with unemployment way down, and Christmas coming up, I don't see a recession in the immediate horizon. However interest rates will likely go up.


Sunday, October 25, 2015

Clawing its way back 102415

The market is clawing its way back towards where it was.  My chart on SPY shows an up signal on 10/6/15. It was a signal that I found hard to believe made sense but that is the advantage of a cold and mathematical calculation based on logic. It pinpoints ups and downs and minimizes risk and sometimes reward. Yes. Technical analysis is far from perfect. It can also result in losses. But it is the only logical way that I can control my emotions and attempt to follow a red-green light approach to investing.

From a fundamental standpoint the economy is growing and appears to be picking up some steam as measured by GDP quarter to quarter. Unemployment is down to its lowest levels in the last 8 years. Interest rates are still low due to fear of a global recession, although Janet Yellen is very likely to at least put one small step forward in increasing interest rates in the next 6 months. Oil is down. Inflation is low, too low actually at 0% after considering oil. Desired target for inflation is 1-2%. So whats there to worry about?


A lot actually… the US election process will gather steam injecting its level of uncertainty. And then there is the unknown and the black swan. Still, this is an environment for moderate investing while keeping an eye towards the door. The market has been going up for 7 years now.


Sunday, October 11, 2015

401K Monthly Analysis - Caution 10/11/15

The market has bounced from its lows and it is normal to feel that I should get back into the market. Having avoided the drop, I have to now look at re-entry. The overall chart on SPY shows an up signal but will soon run into resistance at 204. The market is still seeking direction. Short term stochastic is high and I expect some pull back. See chart below on SPY.

It is also interesting that in my 401K analysis the funds that are coming up for investment includes Contra funds and bond funds. This is the first time I am seeing bond funds show up. Not a good sign… as this is a momentum based system and normally it stays in stock funds. Also most of the funds are showing negative values when analyzed across a longer 3 and 6 month performance time frame. I do not like to put much money into the market when I see negative results over a longer time frame as this. Therefore I will sit out.

In my previous employer’s 401K funds the top choices are Fidelity Contrafund, Fidelity Freedom 2000 and Fidelity Govt Income.
In my current employer’s 401K the fund choices are now also more conservative. The top funds are Fidelity Freedom 2000, Fidelity Govt income, Spartan 500 Fund. The last one is similar to SPY. The choices of funds that the system is introducing are more bond funds, at least at a 50% level.


I am sitting in money market in my 401Ks and will consider getting back into other funds in a small amount only after a pullback on SPY. That will be tricky as the pullback could change into something worse; but as long as I have an up signal on SPY I will be looking for an entry.


Sunday, September 20, 2015

What’s Next? 92015

The markets have dropped fast and furious on high volume. Then it bounced back up before taking another kick to the guts on Friday…  so far I am doing good aren’t I? I am stating what the media journalists do. State what has happened in the past as that is fully known. Sometimes it is stated in very worldly, knowledgeable language giving the reader the idea that the writer must know what is going to happen next. Fact is no one knows. Let me repeat that. I don’t know. So what am I doing writing an investment blog that I don’t make a dime out of and I don’t know what is going to happen next?

Blogging gives me a chance to think. I admit some of that is on the spot as to what is going through my mind right now. It isn’t like I write a blog piece and then let it gestate for a few days, tune it and then publish it. It is more like what Trump is doing. Firing off what is in his head without the writers preparing set speeches. I am not against set speeches as it is also important for Presidential candidates to outline their position instead of just intoning “I am the best. See how rich I am? Trust me. I will fix this. Trust me. I will do a better job than anyone else”. That would be like my saying “The market is going up. I know it is. Trust me. I know the market is going up”  Actually the market goes up more often than down and if I took that position all the time, I would be right statistically more often than wrong! And that is what financial advisers do.

But this is not about Trump, Fiorina, Clinton or Sanders. I remain out of the markets as the technical analysis shows weakness in the charts. That works for me. We have seen many of the indexes go through the dreaded death cross… even my work associate from Minnesota, who has never claimed to be an investment expert, asked me “should I get out of the market because of the death cross?” . In today’s world you don’t need me to explain what a death cross is. Google it and find out.  But there is weakness in the markets right now and negative inflation because of the low price of oil. Oil affects everything (except college tuition and health care costs). Transportation and material costs which make up a large portion of cost of goods sold is significantly down. That appears to be because of excessive supply, so I will stay on the side lines and watch the market from a distance.


Meanwhile I am now moving into the next phase of investing by forward testing of my automated trading systems. More about that next time.