Sunday, December 6, 2015

401K Monthly Analysis 12/17/15

The market is again at a crucial juncture. It wants to climb higher but the pressure of daily and weekly resistance is against its doing so. My daily and weekly time frame charts on SPY both show downward signals. See the charts below…That is really quite unusual. I am sitting on the side lines right now. I had dipped my toes in for a put option position on SPY but quickly exited with a small profit after the market went down and rushed up on Friday.

In my previous employer’s 401K, the recommendations are to be in Cohen & Steers Realty fund, Fidelity Contra fund and American Century Income Instl. Vanguard Instl Index is also a valid choice after these three.

In my current employer’s 401K the fund choices are Spartan 500 and Fidelity Growth. That means the third choice would be cash or money market.


Sunday, November 15, 2015

France attacked by ISIS 11/15/15

France experienced an attack by ISIS. I am sorry to hear about those that were killed and their families for the loss of loved ones and the many injured people. Their lives changed. Terrorism adds another layer of uncertainty to the markets. After approaching the highs, the market is withdrawing and I am seeing sell signals. I am out of the market with the exception of a position in a bond fund using the Ivy Portfolio strategy. Also I am still in the vertical calls I had sold on the Nasdaq100 QQQ. That expires in December so I will hold it for a little longer to get more time decay before exiting. Both these positions do better when the market goes down.

SPY has an exit long signal so those that want to preserve capital will want to exit now. Stochastic is bottoming out so it is likely to see a bounce after the recent drops. Although with a terrorist attack, people may not be in a mood to go long. I suppose the computer programs running on algorithms really don’t care.


See chart below on S&P500 (SPY) now has an exit long signal. I usually use it to exit my 401K positions; but since I did not go long in the first place, no changes are needed for me. 


Sunday, November 8, 2015

401K Monthly Analysis – Clawing back 11/6/15

The market has clawed its way back to almost its highs. See the chart below on the Spartan 500 fund. It is the only entry open in my current employer’s choices as most of the others are still flashing caution. Emerging markets are very weak. In this environment we would expect bond funds to strengthen but bond funds are retreating at the threat of increasing interest rates. The market is in a quandary as to how to react to the real possibility of a fed interest rate hike in time for Christmas. Unemployment numbers are at its lowest it has been in many years. The US dollar is strengthening at the possibility of higher interest rates, causing oil to remain low. That and the glut in oil supply and that China may be hitting a plateau. We could get a nice Santa rally. I am still cautious and although I should be in the markets, am taking some time out.

In my previous employer’s 401K funds the top choices are Fidelity Contra fund, Fidelity Mt Vernon Growth and Artisan Mid Cap Fund.

In my current employer’s 401K the fund choice is Spartan 500 Fund. Chart below. I would say stay part cash with the rest as there is still plenty of signs that the trend may be tiring. 

See the chart below on the Spartan 500 fund. It is a snapshot over 7 years and shows how the trend has held long for quite some time without a serious draw down, or recession. And with unemployment way down, and Christmas coming up, I don't see a recession in the immediate horizon. However interest rates will likely go up.


Sunday, October 25, 2015

Clawing its way back 102415

The market is clawing its way back towards where it was.  My chart on SPY shows an up signal on 10/6/15. It was a signal that I found hard to believe made sense but that is the advantage of a cold and mathematical calculation based on logic. It pinpoints ups and downs and minimizes risk and sometimes reward. Yes. Technical analysis is far from perfect. It can also result in losses. But it is the only logical way that I can control my emotions and attempt to follow a red-green light approach to investing.

From a fundamental standpoint the economy is growing and appears to be picking up some steam as measured by GDP quarter to quarter. Unemployment is down to its lowest levels in the last 8 years. Interest rates are still low due to fear of a global recession, although Janet Yellen is very likely to at least put one small step forward in increasing interest rates in the next 6 months. Oil is down. Inflation is low, too low actually at 0% after considering oil. Desired target for inflation is 1-2%. So whats there to worry about?


A lot actually… the US election process will gather steam injecting its level of uncertainty. And then there is the unknown and the black swan. Still, this is an environment for moderate investing while keeping an eye towards the door. The market has been going up for 7 years now.


Sunday, October 11, 2015

401K Monthly Analysis - Caution 10/11/15

The market has bounced from its lows and it is normal to feel that I should get back into the market. Having avoided the drop, I have to now look at re-entry. The overall chart on SPY shows an up signal but will soon run into resistance at 204. The market is still seeking direction. Short term stochastic is high and I expect some pull back. See chart below on SPY.

It is also interesting that in my 401K analysis the funds that are coming up for investment includes Contra funds and bond funds. This is the first time I am seeing bond funds show up. Not a good sign… as this is a momentum based system and normally it stays in stock funds. Also most of the funds are showing negative values when analyzed across a longer 3 and 6 month performance time frame. I do not like to put much money into the market when I see negative results over a longer time frame as this. Therefore I will sit out.

In my previous employer’s 401K funds the top choices are Fidelity Contrafund, Fidelity Freedom 2000 and Fidelity Govt Income.
In my current employer’s 401K the fund choices are now also more conservative. The top funds are Fidelity Freedom 2000, Fidelity Govt income, Spartan 500 Fund. The last one is similar to SPY. The choices of funds that the system is introducing are more bond funds, at least at a 50% level.


I am sitting in money market in my 401Ks and will consider getting back into other funds in a small amount only after a pullback on SPY. That will be tricky as the pullback could change into something worse; but as long as I have an up signal on SPY I will be looking for an entry.


Sunday, September 20, 2015

What’s Next? 92015

The markets have dropped fast and furious on high volume. Then it bounced back up before taking another kick to the guts on Friday…  so far I am doing good aren’t I? I am stating what the media journalists do. State what has happened in the past as that is fully known. Sometimes it is stated in very worldly, knowledgeable language giving the reader the idea that the writer must know what is going to happen next. Fact is no one knows. Let me repeat that. I don’t know. So what am I doing writing an investment blog that I don’t make a dime out of and I don’t know what is going to happen next?

Blogging gives me a chance to think. I admit some of that is on the spot as to what is going through my mind right now. It isn’t like I write a blog piece and then let it gestate for a few days, tune it and then publish it. It is more like what Trump is doing. Firing off what is in his head without the writers preparing set speeches. I am not against set speeches as it is also important for Presidential candidates to outline their position instead of just intoning “I am the best. See how rich I am? Trust me. I will fix this. Trust me. I will do a better job than anyone else”. That would be like my saying “The market is going up. I know it is. Trust me. I know the market is going up”  Actually the market goes up more often than down and if I took that position all the time, I would be right statistically more often than wrong! And that is what financial advisers do.

But this is not about Trump, Fiorina, Clinton or Sanders. I remain out of the markets as the technical analysis shows weakness in the charts. That works for me. We have seen many of the indexes go through the dreaded death cross… even my work associate from Minnesota, who has never claimed to be an investment expert, asked me “should I get out of the market because of the death cross?” . In today’s world you don’t need me to explain what a death cross is. Google it and find out.  But there is weakness in the markets right now and negative inflation because of the low price of oil. Oil affects everything (except college tuition and health care costs). Transportation and material costs which make up a large portion of cost of goods sold is significantly down. That appears to be because of excessive supply, so I will stay on the side lines and watch the market from a distance.


Meanwhile I am now moving into the next phase of investing by forward testing of my automated trading systems. More about that next time.

Sunday, August 23, 2015

The Market made its decision …. And here we go.. 8/23/15

The market made its decision as to how to resolve its sideways action and down we go. This is why I like technicals as I did see this coming and am sitting on the sidelines. See my last post. The SPY ETF is now showing a down signal. The trading system I have on it is definitely weighted to the upside, so when I get an exit long signal, I get cautious and leave my long positions. When I get a down signal on SPY as we see now, that is certainly more serious. Friday’s drop was massive. Most investors are going to be surprised when they get their portfolio positions as the market is definitely down about 7% for the year and will impact 401K accounts. Gold (GLD) and Treasury bonds (TLT) have perked up.

When I look at the chart on SPY, I see high volume spikes already occurring. That may actually suggest that we could be approaching a reversal point. See the last time we had a volume spike on SPY after the drop back in 10/15/14, the market reversed back up. This time I expect we will see more pain but fast drops do lead to quick upside reversals as well.  I will go ahead and start watching for a place to buy some long call positions on QQQ and/or SPY to make some money on the reversal. I will be wanting to buy when the high for the previous price bar is exceeded so as to avoid buying too early. 


Oil has got slaughtered more since my last post. Technology sector for the S&P is down over 6% and has a greater weighting on the S&P than oil. I looked at blue ribbon stocks like Exxon last month and saw comments from folks who said that as Exxon (XOM) dropped that was a great buying opportunity. Not for me. As far as I am concerned when the stock has a down signal, I don’t care if it’s a blue ribbon stock, I am out of it. Down means down and there is no way of determining how far these down drops will go. XOM is down more than 28% to $72 from its high of over $103. Needless to say that is huge. I will consider up when I get an up signal.

Part of me still says this drop is just not enough….that we should be prepared for more. Still I think we will expect a bounce before that happens.. and I will need to use suitable technical to call that out and not trade based on just emotion.

Sunday, August 9, 2015

401K Monthly Analysis – Still Sideways but… 8/9/15

The S&P100 (SPY) chart shows an exit long signal and remains heading sideways. Overall it feels like the market is dropping down based on recency as the Dow Jones 30 (DIA) has had several down days in a row. The Nasdaq 100 ETF (QQQ) is also showing a down signal but is caught in a sideways trail. The Dow Jones 30 has actually dropped below its support and is the weakest of the 3.  See charts for all 3 below. 

Given this environment I am in money market funds in my 401K. Overall the market has been treading sideways for several months frustrating traders. The only resolution possible to a sideways market is either up or down. Right now the signals are all down and it is what keeps me out of the markets. If the signal turned upwards and that is certainly possible, I would change my mind. I do not know which way the market will go down the road. No one does. All I can do is follow my signals.

Based on monthly analysis, the strongest funds in my current employer’s 401K fund choices are: Fidelity Div Intl, Fidelity Blue Chip Growth and Fidelity Growth. I am in none of these for the reason stated above; but if I were to follow a momentum method in my 401K then these would be the funds I would be in. 

In my previous employer’s 401K funds, the strongest ones are TRowe Price Intl Disc, Fidelity Div Intl and Fidelity Contra fund. Again, I am in none of these and in money market funds in my 401K. I have a small amount in Fidelity Govt Bonds but should shift that to money market Monday.


Sunday, July 26, 2015

Where is Oil Headed (Continued) 7/25/15 ?

Where is oil headed? I am not a typically contrarian investor. I follow technicals and am willing to shift my position based on the way the mood shifts in the technicals. My current charts on OIH and USL is posted below.

Right now the technicals show a downward trend and that we are at another juncture of support. A breakdown of this support will generate even lower prices and a better bargain for bottom fishers. I for one like low oil prices as it means less pain at the pump. It also fuels travel and business. Without pontifying about the world economy and other matters where there are enough articles out there on the net, the situation currently on oil is down. Only question is will it find support or keep going down?


I will consider up only when my technicals change and show the signal change from down to up and the price is above the Supertrend line..


Sunday, July 19, 2015

Making Money with Automated Trading – My “Smart” Trade-bot 7/19/15

Is it possible to have an automated trading program running on an algorithm would make me money consistently? After 9 months of development work on weekends, I think I have come one step closer to achieving that. Using Ninja Trader software with Bloodhound I have created an algorithm that will run less than 2 hours a day and will trade Nasdaq e-mini futures (/NQ) generating 100%+ returns in a year per the back test. I tested the system from end of June last year to end of June this year. The test shows that it would have generated a little over 120% return. I prefer to have an exit based on the trading logic but also using a wide take profit of 160 ticks and a trailing stop loss of 120 ticks. I figured in trading commissions and a 1 tick slippage. If my assumptions are optimistic, and we had 2 ticks slippage it should still be very positive.

Here is the equity curve generated by the program based on trading 1 contract of NQ… it looks good but the drawdowns can be 25% and maybe worse in real-time. The win rate is about 55% and that means this will generate 8 losing trades in a row of about 3% loss on average per trade, some time in a year. Money management is a key and one cannot be over leveraged. The equity curve is based on 1 contract. Multiply it by a larger number of contracts and the returns start looking even better. I believe it is possible to trade this with an account of $10,000 per 1 contract traded.


The big question is how useful is a back test going forward? I ask that all the time. Yes, the future is unlikely to be like the past. But when the markets behave in a more volatile fashion is that not a time when randomness is left behind and you have bursts of more predictable behavior? And if I take out my emotional participation and let the trade-bot run on its own then I should have a more objective repeatable result.

Next steps is to run the program using a paper account using real-time live data and see what the results are over 3 months. Using real-time data and forward testing the program I will have another piece of information before going to real money. The equity curve needs to show similar behavior over time in forward testing. There are many pitfalls to doing automated trading. I wish I had a giant hedge fund who would allow me to move this fast forward but I intend to make this happen either ways and will not stop learning and testing other systems in case this does not pan out.

Sunday, July 5, 2015

401K Monthly Analysis – The Greek Vote “YES” or “OXI”

Although it is my month end 401K monthly analysis time, the word is Greece this weekend. The Greeks are going to the poll on a historic national referendum to decide whether they will say “yes” to accepting the EU austerity program for money, or whether they will say “no” (OXI in Greek) and support their leader to negotiate a better deal, assuming that is possible. I hear that there is a generation gap in the vote. The young want to say no to austerity and the Euro while the old are fearful that they will lose all that they have and are willing to give some to keep some by saying yes. I don’t envy the Greeks either ways. I hope the US will never reach that stage where we cannot manage our debt. I am afraid we too have to face some levels of austerity down the road as more and more countries are flush in debt. Borrowing cannot go on forever without having to pay the piper.

This blog site is apolitical. My focus is on blogging about trading, investing and making money. SPY is signaling down (S&P 500 ETF). Chart shown below. See the stellar returns SPY has shown over many years. Hidden in that is the gut wrenching drops that the recession created but the strength of the US economy has recovered all those losses plus more.
Given the exogenous events (as one of my Mcubed friends puts it) and that SPY is pointed down, I am out of the markets in my 401K and resting in money market funds. Markets dislike uncertainty and we have that in spades now.

In my current employer’s 401K choices, Fidelity Growth Strategies, Fidelity Div Intl and Fidelity Blue Chip Growth are the strongest funds. If one were to stay invested throughout then these would be the ones I would be in.

In my previous employer’s 401K funds, the best choices are T Rowe Price Intl Discovery, Vanguard Explorer Admiral and Fidelity Contra fund. These are the strongest. Fidelity Div Intl is also a good candidate. International funds are looking strong despite the Greek vote. Perhaps it is due to the weakening of the Euro?

My current investments are small and hedged in options trades. I own put options on the QQQ and vertical call spreads on the DIA (my wife is bullish on the DJ30 and while she is contrarian in her choices and likes to pick up dips, she is right more often than wrong). We will have to see if she is right or Cramer who says don’t buy this dip…. Me – I just want to follow the technical.


Saturday, June 27, 2015

Ask a Market Maker Q&A on Currency trading… 6/27/15

An interview with Elliot Mayerhoff Market Maker and Mark Coe
A Risk disclaimer for currency trading with leverage:  Consider the risks associated with increasing your leverage. A relatively small market movement will have a proportionately larger impact on the funds you have deposited or will have to deposit; this may work against you as well as for you. You may sustain a total loss of initial margin and you may be required to deposit additional funds to cover a short margin position.
Do Market Makers gun for stops?
Buy or sell orders with stops go into effect after the stop level price is crossed. This is how stops are used – Market Makers (MMs) are able to see these stops and also have a good idea where traders place stops. The concept in the retail trader’s world is that Market Makers (MMs) gun for stops. This is particularly prevalent in the Forex currency trading world. There is a bid and an offer. Professionals and larger buyers will say to buy it at bid or do the best you can. MMs in the big banks are not too concerned about going after the retail traders specific stops. That does not mean the MM will not go after certain specific levels. Euro has a very good liquidity and it is traded very tight. 1-2 ticks. 150 (million) euros would normally not move the market; but who has that order may be of interest. Banks and traders want to know whether that is a Fibonacci level. The bank trader wonders - Is there a cluster of stops at that level? The more stops at a level and he may want to buy ahead of those levels and formations. Who is giving me this order? Most traders are paranoid. If it is from a large bank he may be wondering – does the person placing his stops know something I don’t? Maybe he will start running the stop. There are a lot of variables. Who is leading the order?  Is it smart money? The bottom line is MMs are not going after any one stop.
Do bank traders use fibonacci levels?
Definitely. You want to combine different time levels and see where the fib levels fall. For example using daily, weekly, hourly and if you have a fib level around the same area, then that is stronger.
Is the MM controlling the market? The answer is yes; unconditionally, yes. But there is competition out there. He is not able to get around to do something unscrupulously to profit. Right now MM is the house. If I call up a bank and the MM and tell him “I want 1.1377-79 as a buying price range… he tells you 1.1387-89… I say “I think you meant 1.1377-79…” No… the MM/bank is saying “I am a buyer. Why shouldn’t I have the right to make the market”? If you wanted to sell at 1.1387-89, you can. MM can show him any market he wants. MMs do not have days to set things up however…  MMs no longer have deep pockets. To a certain extent the MMs do control the markets.

Liquidity in the FX markets - Is FX really the most liquid markets? What happens during announcements? Non-farm payroll … 8:30 am EST they stop quoting. Only desk levels are open. Whoever leaves a stop, they would call and check if you want a stop… it could go 50 points through your market stop.
If you sell or buy outside of the US there is going to be the need for a hedge.  MM has to hedge out options. MMs just want to play volatility and not direction of the market. Before you had the FIX at 11:00 am EST.  Bigger banks would get in a chat room. It is small world with MMs. MMs and Traders could sell using a chat room and reach a deals with a buy and sell privately for large quantities. If they all have a lot to buy, then they would discuss how they will collude. They arrange amongst themselves and the customer gets s*&%#%d. They drive the price up higher but have been buying it earlier… This is the 11 O’Clock fix. How do you buy 5 Billion dollars in 1 sec? That is a lot of money at any time. This is however no longer the case as banks are looking at chat rooms.

Do the big, smart people get it wrong sometime?
You only hear about the success. No one talks about all the failures in professional sports, just the successful ones. There are many hedge funds going out of business. John Paulsen made a lot of money in the sub-prime, getting it right … $1 Billion… but many of his customers lost a lot of money after that. You don’t hear about that. The percentages are much worse than 30% winners. You only hear about the winners. Not the losers. Many hedge funds went out of business.

MM got to see both sides of the deal. What did the successful ones do? 
Traders all have their own style. Everyone has to understand their own style. MM would say that the guys who were more successful were the ones that were looking for a longer point of view. People that understood risk management and riding the trend did better. People who had more staying power did better. They rode a trend that was playing out in the market and those were the ones who were most successful.
There were a lot of successful people. There was one who traded every day in the morning. He traded the USD/Yen. He always came out every day on the right side by trading 3-4 hours in the morning. A trend following trader will do well when it is trend trading. He will get killed when it is going sideways. But the better trader are the ones who have good money management. High frequency traders are short term traders and they have kept volatility down… They are the algorithmic traders. There are more algorithmic traders who are trading on a very short term. Many are successful. 

Friday, June 5, 2015

401K Monthly Analysis – Sideways Shuffle 6/5/15

This is my monthly 401K post. The chart of the S&P500 (SPY) remains moving sideways with an up signal. That in itself is remarkable as the talk of gloom and doom has far outpaced the actual performance of the US markets. The bond markets are definitely showing pain. This is demonstrated on the chart of TLT, long term treasury funds. PIMCO Global bond fund is pointing down. And so is IYR Real estate funds ETF… one is left with a gloomy picture and I have succumbed to it by going to cash. The technical should have me in stock funds… but which ones?
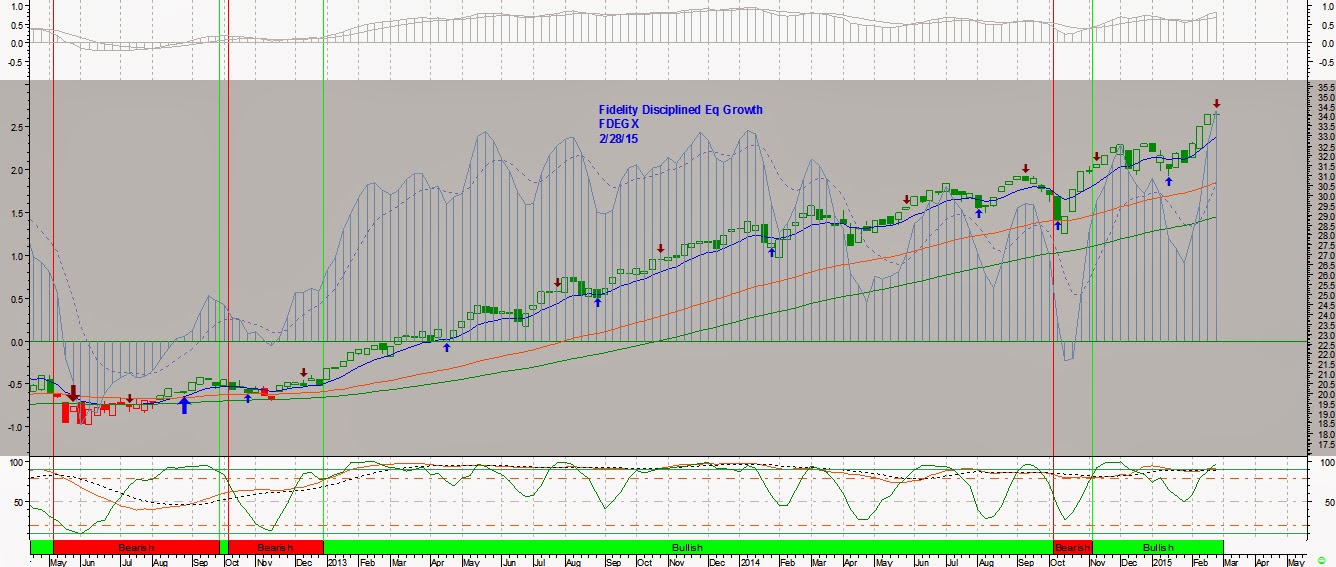
In my current employer’s 401K the strongest funds to be in are Fidelity Invst Div Intl, Fidelity Growth Strategies and Fidelity Blue Chip growth. Bond funds in the 401K are currently losing money. International is still holding up although it seems to be starting to turn down. Forget Real estate funds right now… the Growth strategies are strong is also reflected by the QQQs treading sideways. So the strong funds are going sideways, and the weaker ones are swooning… not a comfortable time in the markets.

In my previous employer’s 401K the strongest funds are TRowe Price Intl Disc, Fidelity Invst Div Intl and Fidelity Mt Vernon Growth. Once again the international and growth funds show strength.

This is a time that if one is invested, it might be time to pare down. But if the market breaks through the resistance, investors will pile on in a hurry.


Sunday, May 24, 2015

Where is Oil Headed?

Sunday morning. Its Memorial Day weekend. I had breakfast with a friend of mine visiting from Michigan. Nice crowd at IHOP as we discussed family, friends and investments. My friend is a contrarian investor. He said “take a guess as to where I am putting my money”… I replied Greece? Russia? The Ruble? He said “no… something in the US… Oil”.

After breakfast I went home and as I sat down to watch the Chelsea versus Sunderland, Premier league soccer game on TV, I looked up the ETF OIH, USL and the stock SLB. Charts for OIH and SLB are shown below. Looks like oil bottomed out – I see a double bottom on OIH and then the move up. We are now making higher highs, which is the classical definition of an uptrend. The uptrend is facing headwinds with the 200 exp moving average (black line) but the trend is certainly up nonetheless and is bouncing of the 50 exp moving average (red line). SLB has broken through its blue downtrend line and slowly climbing back upwards.

Fundamentally, there is global growth, which will continue to fuel the demand for more oil. Countries like Saudi Arabia, Iran, Iraq, Russia, and Venezuela will keep producing more oil regardless of fluctuating demand. When there is an oil glut and price drops, it will be the shale producers in the US who are “for profit” companies that will blink first and stop, reducing output and thereby again increasing the price of oil. Long term oil prices will have a bottom. That may be the double bottom we have seen or further down, but the nature of supply and demand will keep oil within a range. US is on the verge of being the largest oil and natural gas producer in the world but we are profit driven. When the price of oil drops, shale producers have to close down as they will not be able to sustain production at a loss for long. Also, their cost of production is likely higher than some of the Middle East countries. Short of a recession, I would expect oil to hold. 


I think oil and SLB are good investments for a contrarian investor. I don’t like the immediate technicals, such as OBV and the slower stochastics pointing downward. With some pull back, this should be a good buy and I think I will follow my friend’s suggestion and put some money into oil using the technicals to figure a turning point as well as a stop loss level.


Saturday, May 9, 2015

401K Monthly Analysis – The trend that refuses to end

All kinds of pundits are saying we are due for a correction, time to get out but the market keeps wanting to go up. As long as Yellen holds up on raising interest rates, and as long as the growth remains tepid, we are trending upwards. S&P500 (SPY ETF) remains caught in a sideways motion for a few months now and the only resolution possible is Up or Down. See chart below.

In my current employer’s 401K, the funds showing most strength are Fidelity Growth Strategies, Fidelity Blue Chip Growth and Fidelity Div Intl. Growth, Blue Chip and International.
In my previous employer’s 401K the top funds are Fidelity Invst Div Intl, Artisan Mid Cap FD and Fidelity Mt Vernon Growth…  all in all, a blend of growth and international funds again. Bond funds are nowhere in the top few yet.  

Long term treasury bond fund (TLT) hit a lower low and has been retreating. The inverse bond fund TBF is showing signs of strength. See chart below. All this has been on the likelihood of interest rates going up. There are those that feel that the Feds cannot raise interest rates and if we see that, then the market may very well surprise the pundits once again. I remain cautiously optimistic.


Sunday, April 26, 2015

Ivy Portfolio Status 42615

My implementation of the Ivy Portfolio by Faber and Richardson is to use tactical asset management with each of the 5 domains to diversify in: Bond Funds (AGG, BND), Real Estate (IYR, VNQ), International Stock funds (EFA, VEU), US Stock Funds (SPY, VTI), Commodity funds (DBC, RJI). When my technicals give me an entry, I put money into one of the two funds in the domain that is signaling up. Right now, I am in SPY, VEU and DBC. See charts on those below. I am half strength in DBC because the fund is well below its 200 day moving average and will have to work its way back up. VEU is moving up the strongest, and I think that is because of the QE program ECB President Mario Draghi has Europe in.

In my last post I had mentioned that MSFT needed to break out of its downward pattern… and it did and gave a buy signal before earnings announcement. Unfortunately MSFT is not something I invest in. It behaved very well and gave an up signal prior to the earnings announcement and then jumped up…. there were investors already betting on the up move before the earnings announcement. Could it be that they knew the good news coming or was that just chart optimism from the double bottom?
See the refreshed MSFT chart below.


MSFT chart below:


Saturday, April 11, 2015

Is it time to buy MSFT? 4/11/15

A friend of mine asked me if it was a good time to buy Microsoft now as it had come down from its high. Show below is daily chart on MSFT.

MSFT has been in a downward signal since the end of last year. It is still in the throes of multi-month pullback - see the blue line sloping down touching the local highs and being unable to cross the trend line... I would wait for that trend line to be broken and an uptrend to be established before going back in. In an uptrend the 50 day ema should be above the 200 day ema ... It is currently opposite of that. If you are a contrarian or aggressive investor then you could enter... but I am not.
So far the price is holding above its support which is around $38-$40. It may start moving up or could break down below $38. One could take a chance and buy keeping the $38-39 as a stop loss level depending on appetite for loss.


I prefer to trade the uptrend by buying on dips ... for example you will see on the chart larger arrows which give the primary trend direction and small arrows which are the contrarian signals suggesting when you can buy on the dip if the larger arrow is also pointing up. Earnings season has begun. Perhaps the market is waiting for earnings news to decide which way to turn.


Saturday, April 4, 2015

401K Monthly Analysis - The Trend Pauses

The S&P 500 (SPY) remains in an uptrend but short term in a pull back. As one of my IIT classmates and expert market Guru from India, Deepak Mohoni states “When you buy on pull backs you can only be wrong one time”.  There is a saying that “the trend is your friend, until the end”… and right now we are in a pull back.
My chart on SPY shows an exit long signal from 2/2/15 and I am taking a break from participating in 401K funds. See chart on SPY below. I am conservative as far as investing is concerned and will give up upside gains to avoid large losses. I show long signals on IYR which is a Real Estate ETF and also in VEU which is a Global fund excluding the US. TLT, Long Term Treasury fund also shows an up signal. I am long these funds.

In my current employer’s 401K funds, the top choices are Fidelity Growth Strategies, Fidelity Blue Chip fund and Fidelity Div Intl fund. Royce Opportunities is also showing some recovery from its large drop. Attached is a chart on Fidelity Growth Strategies. Since SPY is showing an exit long, I am out of my 401K.

In my past employer’s 401K fund, the top choices are Cohen & Steers Real Estate fund, Fidelity Spartan Extended Market Index and Fidelity Mt. Vernon Growth fund.


Some market pundits are trying to stay ahead of the market by calling for a potential drop in markets for 2015 since the market has been plodding upwards for 6 years. SPY or the S&P500 has never gone into a major decline without the 50 day exponential moving average (ema) dropping below the 200 day ema. From the chart on SPY I see that the red line (50 day ema) is still above the black line (200 day ema). I think there is still plenty of time before we see a major decline … at least 3-6 months. I try not to get too ahead of myself with long predictions as no one really knows. However based on the past, I would say we have time… and yet I am exited on my 401K… I am conservative, no doubt. I still follow the Ivy Portfolio signals and right now, it has me long in IYR, VEU and even DBC. The last one is a commodity fund and it has dropped to half its value… and I just entered it end of last week. It looks like it made a double bottom. If the world can reach an agreement with Iran on their nuclear program, then oil will flow freely from Iran into the markets and we could see past support for oil breaking and oil going much lower. There is some thought that there will be a greater need for oil tanker storage. Stocks like NAT (Nordic American Tankers) may be a better investment as oil producers produce more and more oil… 


Friday, March 6, 2015

Market Topping? 3/6/15

The US markets have been on a tear for over 5 years now… and we wish it would stay this way for another 5. The latest jobs data shows unemployment at 5.5%, a long way down from the 10% we were at back in 2008. QE has worked to boost the economy and low interest rates have allowed the stock markets to flourish. But with the 5.5% unemployment the market worries that the Fed will start raising interest rates. Higher interest rates may slow the economy… and therefore the markets took a breather.

When I look at the chart of the Dow Jones 30 as depicted by the Exchange Traded Fund (ETF) known as DIA, I see a down signal. This down signal is still under the background of a strong up trend. Prices are still comfortably above the 200 day moving average shown as a dark black line on the chart for DIA below. Almost all the market move up this year has been nullified after the steep drop today. Also note the trend line violated on the OBV (On Balance Volume) panel at the bottom of the DIA chart. I have found that to be something to keep a watch on for shifts in trend. For now I am expecting the market to continue to show some weakness. I am considering selling some call spreads on DIA... 

I have to be wary as we are still in an uptrend.
One ETF that I am in is TBF. It is an Inverse Bond fund. See chart below on TBF and the long entry signal it flagged in green. I believe that trading TBF or TLT depending on which one is giving a buy signal allows me to trade a bond fund almost all the time… the chart on TLT has a down signal and is starting to get to being oversold… that means it is soon going to take a small bounce before it takes another drop.

A trade I just closed out today on market open was the trade on TAN (solar ETF). I review charts at the end of day and placed the trade to close my position next day market open so that it will close out without my having to watch it. TAN has had a very healthy bounce thanks to a Chinese Solar company that has moved up over 40%. It is a significant holding within TAN, or so I have read; but TAN is extremely oversold… see the pink balloons above the price and it was time for me to bank profits. I like to call it quits when I see two pink balloons above the price… as TAN is very overbought at that stage and traders will take profits (like me). I am mostly cash now…


Chart on DIA


Chart on TBF


Chart on TLT


Chart on TAN

Sunday, March 1, 2015

401K Monthly Analysis –Market Update 22815

Markets Analysis: The markets have continued to move up in a low interest rate environment and now fueled by the QE coming from Europe. My stock chart on SPY (S&P 500) remains mysteriously pointing towards an exit long signal while the markets have moved to new highs… The chart on QQQ shows an Up signal. See charts below.

Looking at my past employer’s 401K the top performers that the momentum method favors are Mt Vernon Growth, Cohen & Steers Realty and Vanguard Instl Index funds. Next choice would be Artisan MidCap FD.


In my previous employers 401K funds the high performers are Fidelity Growth Strategies, Spartan 500 Fund and Fidelity Fund. Fidelity Div Intl has also broken out of its downward funk and is the 4th choice. The chart below on Fidelity Growth Strategies shows a short term sell signal based on being overbought. It has had a nice move up. The bottom of the barrel is Royce Opportunities…which has not done well and is still in a consolidation downwards... 


Sunday, February 1, 2015

Developing an Automated Trading System – 2/1/15

It has been my dream to have a money tree. It would take some nurturing, adding nutrients and water but US dollar notes would sprout from the tree. Alright, I know that is not in the likely realm of occurrences! My proxy dream is to be able to develop an automated trading system. I would be trading e-mini Nasdaq 100 futures (or oil futures) on a very short time frame and preferably either just the morning or the afternoon. The computer would have my algorithm saved in its brain. It would include a time solver so that at the start time it would wake up and look for signals and at the end of the session it would close any open trades... On receiving a buy signal the computer would automatically place the trade. A short time later after it reached its profit objectives it would take profit. All along the process, it would also have exit plan so that if the futures behaved differently from what was expected, it would exit the trade for a small loss and wait for the next signal.
Till recently, I did not think I could do that as I am not a C++ code developer. I think I am pretty knowledgeable on technical analysis but converting that knowledge to an algorithm and then back test it seemed impossible with my limited capabilities (COBOL, Basic and Fortran) in programming. But that was till 2 months back when I ran across Sharkindicators Bloodhound software. 

See link for its home.        http://www.sharkindicators.com/
 Quick Start tutorial          https://www.youtube.com/watch?v=0viC-gSQIw8

With this software one can take technical indicators, even with multi-time frames and using visual drop and drag boxes that have my indicators and logic, combined with and/or and many other node features create quite sophisticated trading systems. Additionally Bloodhound is written for ninjatrader software which can go to any of several brokers who specialize in low cost futures trading, placing buy and sell trades. And did I say that short term futures trades are treated as long term capital gains for taxation? Go figure.


So here is a chart of a quick system I was back testing. It uses MACD’s sweet spot when it breaks out close to 0 and a medium speed EMA (exponential moving average) like 20 to decide which direction it will trade and when. The chart shown below is a 2 minute chart of NQ. I started practicing back testing with it using 1 minute past data from last year. I am testing it during the first 3 months of actual data from 2014 and where the results look profitable, I tested it again for the next 3 months. I changed the Take-profit level from 6 ticks to 48 ticks in 6 tick increments. Each tick is worth $20 in profit on one contract of /NQ. The results show that keeping a take profit in the range of 24 – 48 ticks is much better than keeping it tight at 6-12 ticks. Small stop loss values are not very effective with this system as it is not super well timed for entry. I may consider adding stochastics to it and improve timing. I can enter only when stochastics is below 80 or 90, a typically classic signal to enter on weakness but in the direction of the long trend. I left the stop loss as unspecified and allowed the system to exit when the opposite signal was generated.
The beauty of the software is that I can take these systems with all its variables through its paces and better understand the hard and soft regions of profit and losses. This trading system is certainly not always profitable but it has promise. I have many ideas for trading and this software has given me the capability to start with taking a few simpler systems through its paces before I get into ones that are more complex. I purchased Sharkindicator’s Bloodhound Ultimate version which sells for $495 and also the BacktestRenko option which is additional.

I look forward to spending many hours listening to Youtube training videos by Jeremy Tang the creator of the software and Zac, one of their experts.  I can fine tune and testing many ideas using technical analysis coupled with logic algorithms to come up with my money tree. I don’t expect any if this to happen quickly and expect many hours on weekends to make this work. But it will be worth it….


Saturday, January 17, 2015

Swiss Surprise 1/17/15

Earlier this week the Swiss National Bank (SNB) scrapped its three-year-old cap on the franc against the euro. The announcement came as a huge surprise to the currency markets and within minutes the Swiss franc jumped 30% against the euro and the US dollar. In the world of Forex currency trading, where Billions are traded and retail traders can take advantage of high leverage, a 30% move meant those with short positions on the Swiss franc had their accounts wiped out in minutes. Liquidity completely disappeared. There were no takers on the opposite side. Those with stop losses found that brokerages had shut down trading. Stop losses mean nothing when trading is stopped. 

Retail traders were snuffed out. Understand that with a $10,000 account you could be controlling $200,000 in currency – that is leverage. When there is a 30% move the other way against you in such a short time, it creates a $60,000 loss. The small $10,000 account is wiped out. Then the FX broker is scrambling to shut down his position while there is no liquidity. Major FX trading houses like Alpari (UK) failed… wiped out. FXCM in the US was chest deep in debt and had to have money poured into them from outside. A large Everest capital hedge fund has closed. The fund had been betting that the Swiss franc would decline. Many will ask, why were they not truly hedged... hedging costs money. In the chase for larger returns, we leave ourselves open to more risk. While shorting (selling) the Swiss franc against the USD or euro, one could buy calls out of the money and hedge one's position, reducing risk. Most don't.  
Looking at the chart below on FXF we can see that the technicals were pointing downward for the Swiss franc when the announcement came. However after the announcement by the SNB and FXF spiked. FXF is not a leveraged instrument but FX currency trading is and so are futures.


Some people came out like bandits. Maybe rich Russians who had moved money out of the ruble and stuck them in Swiss francs in Swiss banks…  Swiss chocolates, Swiss vacations and Swiss cheese are now a lot more expensive… all this makes me realize the risks in leveraging. While returns can be quick and fast, a major black swan event will wipe out accounts, brokerages and create massive losses for the major banks and it did. I will always remember the ugly side of leveraging…and hope it never gets me...these are the dangers of trading FX and futures markets... risk and reward are inexorably tied together.. just different ends of the same spectrum.


Saturday, January 3, 2015

401K Monthly Analysis – Happy New Year 1/2/15

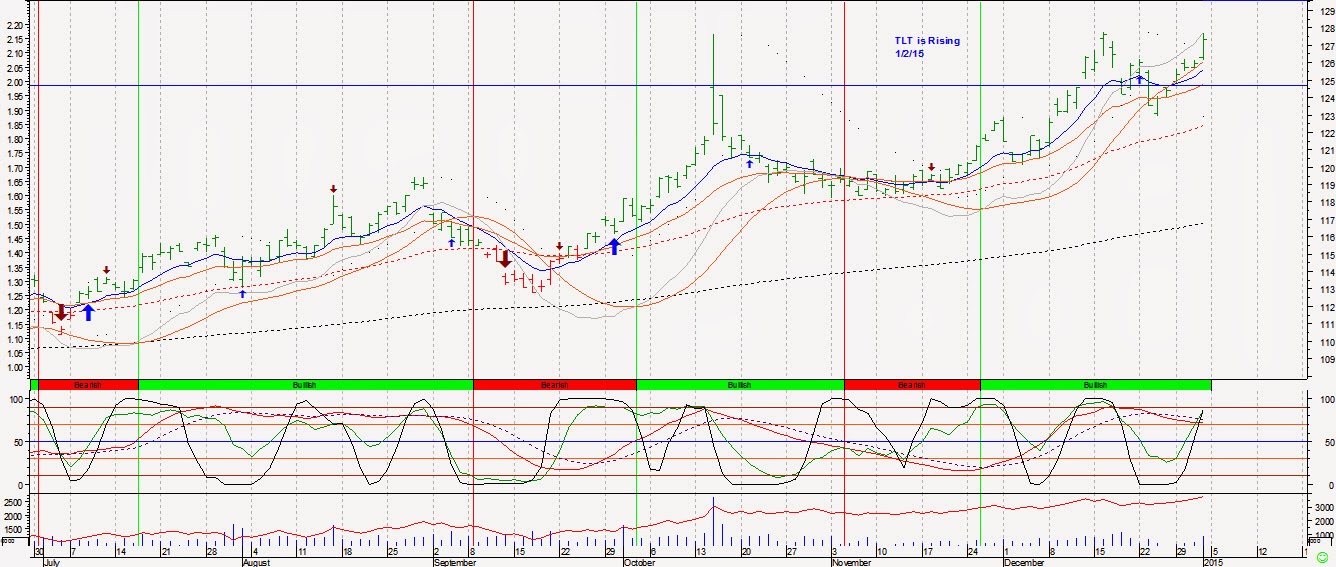
Market background: The chart on SPY shows an Exit Up signal. Meanwhile DIA (Dow Jones 30) is still holding on to an Up signal. Long term Bond funds TLT is rising (See charts for all 3 below). Oil is getting decimated. The chart on USL slopes downwards at 45 degrees with an unrelenting drop. Gold remains weak and could slide lower with the US Dollar strengthening.. Real estate IYR is up. And the US Dollar is strong against most international currencies… with the weakest having been the Ruble. After the Russians raised interest rates on the Ruble from 10% to 17%, the Ruble appears to have found a more solid footing. However the Russian economy is in the tank due to lower oil revenues caused by low oil prices and a sliding Ruble.

Top choices for my current employer’s 401K monthly analysis using my momentum analysis are Fidelity Growth, Spartan 500 and Fidelity Blue Chip.
In my previous employer’s 401K top fund picks are Cohen & Steers Realty Fund, Fidelity Mt Vernon Growth and Vanguard Instl Index.

The economy shows strong GDP. Market is still pointing upward. Interest rates are low.  And should we be thanking the speculators for dropping oil prices since we blamed them when oil prices were above $100?