Sunday, December 29, 2013

New Year’s Investing Resolutions - December 2013

The Santa Rally came in on time this year. It is now almost the end of the year and time to ponder about what to expect next year, what mistakes I have made and what I am going to do about it next year. One cannot change the past. The only point in dwelling on the past is to prevent mistakes from recurring.
After such a strong year, I expect we will have a modestly positive next year in the 5-8% gain range. There has always been what is called a reversion to the mean. When the value of SPY (S&P500 Exchange Traded Fund) goes up and is 8-12% above its 200 day exponential moving average (ema) it back peddles and gets back close to the 200 day ema. History shows that this is 100% the case. See chart on SPY below. Once more I should point out that the Up arrow on the chart below signals long. The blue bubble signals an exit to the prior signal and reversing of direction. Therefore treat the blue bubble after a down arrow as a enter long signal in this trading system. The black line is the 200 day ema. During down trends and when price drops below the 200 day ema it can go much further down, as much as 40-45% below its 200 day ema but it too is eventually always mean reversing. This does not mean the price will not rise once it goes up above its 200 day ema substantially; but it does mean that it is likely to go sideways and possibly pull back enough for the 200 day ema to catch up to it eventually. Regardless of the direction it goes, I need to rely on my own trading systems for the signals which I post on this blog site. Follow the systems at your own peril!! I will.

My first New Years resolution in trading is not to listen to others and instead follow my own trading systems.
That means I will not pick up newsletters from others as this can create conflict. When my system says long and someone else says we are in for a huge bear market, then it creates confusion for me that I do not need. If my system says long then I will posture accordingly. I do not need someone else to guess what is going to happen.

My second resolution is that I will add some aggressive systems that will enable me to pick up higher gains.

My third resolution is that I will position for the down side when I get an exit signal on SPY and look to breakeven or make a little money when the market goes down. I will do that by buying negative ETFs like SH or put options.

My fourth and final resolution is to develop an aggressive Futures trading system that will generate a much greater than market return. This will be my true ticket to independence if I can reach it.


Let us all hope to have a healthy and Happy New Year….


Sunday, December 22, 2013

Frustrations in Trading 12/22/13

I am an Engineer by background and part of a senior management team for my company. The tools I was taught were math, physics, chemistry, and all those engineering courses that only reinforced black from white, a correct answer versus a wrong answer. We did not get positive grades for almost correct answers (although we had teachers that did credit our work sometimes). We learned to be careful and correct. Well in trading that becomes a lot harder to figure out.

In trading, I get frustrated with a trade that turns South on me after I enter. The more risk I take, the greater the loss when it occurs. And it tends to occur right away, making me think twice about taking a risk again. Then another entry signal pops up. I either miss it or avoid taking it. And sure enough that signal works out great and the stock climbs up beautifully without me on board. I look at all the $$$ I coulda shoulda and woulda made. Frustration mounts…

Or listening to my co-worker tell me that he had been trading this XYZ stock for ever and he wished he had bought it when it was $1.50 a share (It used to be $70). But when the markets turned down, he had no extra money to put in. He was stinging from the losses and did not have the nerves or capital to buy more. Another example of Frustration in trading. Missed opportunities.

When the markets turned down in 2008, the VIX (Volatility index or Fear factor) spiked from the teens to climbing up above 50. There was Lehman Brothers going bankrupt at the time while Cramer said Buy – Buy – Buy the week before… There was plenty of blood on Wall Street and Main Street. I remember telling co-workers that the guy who jumps in now into the market is going to make a killing (I had been spared the downturn thanks to technical analysis). I had cash sitting in my accounts; but did I jump in and buy stocks then? No. I thought I could limit my risk and buy put options on 5 financial stocks, as I had no way of knowing which one would suffer the most.. But I did not do it. Missed opportunities. Frustration… knowing what to do when; but not being able to do it because of fear and risk. How many of us can overcome that level of fear and take the trades? Very few… I vow to do that next time…

Another frustration can occur from not getting out of a bad trade when the signal came and went... I have very few of those, although I do make an occasional mistake or miss a signal.
I had posted a chart on Ford end of November urging caution and scaling back. It looks like that was well timed as the stock has broken down since then. See below. If a person saw this post and did not react, then he/she will be facing the frustration of missed signals. If I missed the signal I would get out now and not get frozen.


I do know a friend who is fearless. He likes to jump in when there is blood everywhere. A true contrarian trader. He has done well… sometimes being the slow and steady trend following trader is frustrating, particularly if you miss a trade that really makes a killing. The crazy thing about trend following systems is that a few good trades make the bulk of the returns. Rest of the trades are slow deaths. The only way to succeed then with such a strategy is follow the charts and stocks you want to trade, and take all the signals. With trading there is always losses and pain. But if you can climb to the level where you follow the system through the pain and losses, then over time you will have a steadier equity curve than those that are doing investing without any tools other than hope and prayer. Even contrarian traders can see stocks go from bad to worse and get in the way of a falling knife. 

Trading is a frustrating business, filled with many stabs of losses. There are always other stocks and other markets showing better returns than I am making. I have to be happy with my equity curve pointed up year over year and avoiding the huge losses that would make me give up this business altogether and put my money in a bank account earning 0.2% interest… I will strive to build better systems that mesh with my personality in trading. Managing frustration in trading is very difficult and there is no way around it; but to confront it, deal with the pain and find a way to move on recognizing there are always going to be losses along the way..

Sunday, December 15, 2013

How are my Investments doing… 12/14/13

The markets have been roaring upwards throughout this year. Or have they?

I took a look at the performance from May 2013 through December 2013 and observed the following:
+ While the markets (SPY) in the US have gone up 6.7% since May 2013; and International markets (VEU) up 1.9%, \
- Bond funds (TLT) have gone down -13.1% and real estate funds (IYR)  down -18.7%. Commodity funds (DBC) has gone down as well -2.3%
- And Gold funds down over -10%… 
- If one followed a diversified route for managing one’s money, then this period showed a reduction in portfolio equity by -3%.!! That certainly feels bad.
The individual investor then turns to his portfolio manager and asks “How can you be managing my money so poorly? Every day I see the markets making new highs but my account is going down? On top of that I am paying you commissions”. What is the answer to that?

The real answer is that we cannot predict which sector is going to go up too well. I try to do that with my monthly 401K momentum investment strategy; but we cannot know in May, that we need to put all our money into SPY as it will do the best. Using the Ivy Portfolio diversified tactical asset type strategy that I have written about earlier, I can manage my losses by getting out of funds such as bond funds and real estate funds when technical analysis gives us down signals. Even then, the signals typically lag and all losses are not avoidable, just as all gains cannot be captured either. The main value is however in getting a steadier performance in the long run with minimal loss years. Patience – the one word most investors are unable to follow.

What should I do if I want larger gains? The only answer to trying for larger gains involves taking more risk. I can take a basket of stocks and trade them long and short (using put options or vertical option spreads) so that we are market neutral… meaning we can make money going up or down. Even then it is not a free ride as we are open to being whipped more often and any one stock can drop large. Also, quarterly performance reporting can be volatile and can constitute a significant gain or loss for any stock. One approach would be to participate fully in both directions and let the chips fall where they may. In a long only strategy, if a stock does not move up significantly, then the trader looking to make a killing going long, gets killed instead. The past may have shown a huge climb up; but the future behavior over a quarter or a year could be a slow ride sideways or down. In short, there is no free ride and one has to be patient waiting to ride that horse up when the stock performs well. Patience… stay consistent with the strategies and follow them for years.


Index Performance by Sector


Diversified


SPY
SPY %
TLT Bond
BOND %
IYR Real Est
RE%
Commodities
DBC%
Intl VEU
INTL%
Strategy

May-13
166.30

116.17

73.61

26.08

47.82

85.996

8/18/2013
165.83
-0.3%
102.55
-13.3%
61.24
-20.2%
26.43
1.3%
46.93
-1.9%
80.596
-6.7%
9/29/2013
168.90
1.5%
106
-9.6%
64.44
-14.2%
25.87
-0.8%
48.91
2.2%
82.824
-3.8%
12/7/2013
180.94
8.1%
102.92
-12.9%
63.4
-16.1%
25.74
-1.3%
49.73
3.8%
84.546
-1.7%
12/12/2013
178.30
6.7%
102.71
-13.1%
62.01
-18.7%
25.49
-2.3%
48.77
1.9%
83.456
-3.0%

Also note the down signal on the Dow Jones 30 (DIA)..


Sunday, December 8, 2013

401K Monthly Analysis - Santa Rally? 12/6/13

Dare we hope for a last Santa rally?

The market remains buoyed with good news of an increasing employment picture and low interest rates. See chart below on SPY (S&P 500 Exchange Traded Fund). My trading system on SPY remains pointed up. I should add that it has been up since 7/11/13 when the blue balloon showed up on the chart. The blue balloon was an exit signal on the down signal. As I have pointed out in previous posts, ext down means enter long on this system. My strategy is to stay long on my 401K funds as long as the system is pointed up. Any long positions should be treated carefully with stops and rules for disengaging from the market during the period the system signals exit long or down.

My current employer’s 401K funds analysis shows that WFA SPL Midcap VL as the top choice followed by NB MDCP GRTH Trust, and then Fidelity Large Cap. The only change would be from Fidelity Div Intl to Fidelity Large Cap. The Midcap funds have held the top two positions for several months now and I can’t help but feel that they may top out soon. The chart below on WFA SPL Midcap VL shows the cycle indicator at its peak suggesting a pullback as likely. Still, there could be a Santa rally this year and I plan to hold on and follow the system.

In my previous employer’s 401K the top choices are Vanguard Admiral, Fidelity Contra fund, Spartan Ext Market, and Domini Social Eq funds.

I have also chosen to buy some TBF in my R/IRA account. TBF is the ProShares Short Bond fund. It behaves opposite to bond funds which are struggling to keep their head up in an economy that has been positive, raising questions about the Feds needing to raise interest rates. As for investing in gold and silver. I prefer to watch the commodities index and trade those when I get an up signal. Gold and silver has been weak and I am not a contrarian investor who buys weakness, unless my trading system suggests enter based on some upward movement.
I have been working on creating trading systems on about 8-10 stocks that I will trade for the next year. I am using back testing using about 33 different trading systems to pick and sort. In most cases I am using a primary trend following system coupled with a faster secondary system that is often contrarian in nature. I will post a couple of that next time.


Saturday, November 30, 2013

Which Way is Ford (F) Stock Heading? 11/30/13

Looking at the chart on Ford, I am going to say that it is better to be cautious if one was holding Ford (F) stock right now. Why?

Firstly looking at the shaded blue histogram swing trading indicator, I see lower highs. I have drawn a red line across the tops. Meanwhile price is still making new highs. See the black line. When the red line is pointed down and the black line connecting the price tops is pointed up, we are seeing a price divergence. In this case we would interpret that divergence as negative and say that price is making higher highs but with a weaker and weaker level of support as shown by the indicator.

Next take a look at the MACT dropping. These are the dual lines on the price chart. That is not encouraging. Previously when the stock was going up, the MACT was climbing. That is no longer the case.

Meanwhile fundamentals like energy prices are heading downwards, although I have not seen a huge drop at the gas pumps lately. Perhaps that is because of Thanksgiving. If gas prices drop, and interest rates stay low, that would be a positive environment for transportation stocks.

So which way is Ford heading?

The price is still above the blue uptrend line and the overall up trend is still intact. If price breaks down below this then I would definitely be concerned. In any case I would be following the trading signals to protect my portfolio. Be cautious… pare down.  But if price gets back above $18 and the black line, then to the bank we go.

Daily Chart on F is shown below.


Sunday, November 17, 2013

How to Invest in International Funds 11/16/13

This morning I read the news that Sachin Tendulkar retired from cricket after 200 Test matches and a sterling career where he has proved himself to be one of the great batsmen of all time. Sachin is a hero in India. But for the internet I would have missed the announcement as cricket is hardly played here in the US. Even in this global environment that we live in, how myopic we can be. It made me think more International. Which countries are doing well in the stock market? The old stars were the BRIC countries; Brazil, China, India. The new stars are who? The answer may surprise you.

Looking at ETFs (Exchange Traded Funds) we can invest in the major stocks of another country by just buying that country’s ETF. For example
EWA   Australia                                               EWP    Spain
EWC   Canada                                                 EWL    Switzerland
EWD   Sweden                                                EWN   Netherland
EWG   Germany                                              EWQ   France                         
EWI     Italy                                                      EWT    Taiwan
EWJ     Japan                                                   EWU   United kingdom
EWK   Belgium                                                EWZ    Brazil
FXI      China Large Cap
IIF       India Fund

With the momentum analysis technique that I use monthly on my 401K, the best selection would be:
EWP Spain, EWI Italy, EWG Germany and IIF India. See charts below.

Italy has issues with debt, Spain with high unemployment and yet here they are rising faster than other countries. Germany’s inclusion seems expected given that Germany seems to be carrying Europe economically, ever since the Euro was introduced. Prior to the Euro, businesses were exiting Germany because of the high wages and high cost of manufacturing. India was included as it had the fastest mid-range momentum change upwards but the chart certainly has a different pattern.

Technical analysis of charts by itself does not show which funds are rising fastest. A comparative momentum analysis does a much better job of revealing that. A combination of the two can be very helpful to determine direction and then to find an entry and exit point.


Sunday, November 10, 2013

401K Analysis – Market is still pointed Up 11/10/13

It is always more comfortable to second guess the market and hedge our bets by saying I expect a pullback. The stock market cannot go up forever and will inevitably pullback. The charts are still pointed up as evidenced by the chart on the S&P500 (SPY). See below. Charts look oversold, so we might see a short term pullback.

In my current employer’s choice of stocks, the mutual fund with the strongest momentum upwards is the Royce Opportunity fund. Royce funds have been usually in the top three but because of high redemption fees I stayed out of it. If you are however in Royce, I would continue to hold it and you should be seeing nice gains in your 401K. The next two remain WFA SPL MidCap VL and NB MDCP GRTH Trust. The Fidelity DIV Intl fund is showing strength, so if I want an international fund, that would be my choice. See charts below.

In my previous employer’s 401K mutual fund selection, top of the list is Vanguard Explorer Admiral, then Artisan Mid Cap Val INST, then Fidelity Growth and Fidelity Contra is also popping in.

I remain biased upwards at this time. The momentum method that I use for my 401K analysis has done very well for me. It has less in and outs and over time appears better than my daily charts analysis on mutual funds. That may not be true for individual stocks however. The top moving mutual funds stay on track for large periods of time. My experience has been very good with this momentum system..


By the way, IYR has taken a nasty move to the downside, and the last post “Idea for a Long Trade” has not worked out. Despite lining up the broader market with the sector and the individual stock, this one went south. I have to shrug it off and stay with plan.


Sunday, October 27, 2013

An Idea for a Long Trade 10/27/13

A simple strategy for a long trade is to align the market, the sector and the stock in the same direction. When the tide rises, it takes everything up with it.

1. Using technical analysis, I see that the market is in an upward move and is signaling long. See chart on SPY (S&P500) below.

2. Next take a look at IYR, which is an iShares US Real Estate ETF (Exchange Traded Fund). The chart right below SPY is for IYR and it is also long.
IYR fund summary:
The investment seeks to track the investment results of an index composed of U.S. equities in the real estate sector. The fund generally invests at least 90% of its assets in securities of the underlying index and in depositary receipts representing securities of the underlying index. It seeks to track the investment results of the Dow Jones U.S. Real Estate Index 

3. Now take a look at a chart on a real estate company Hovnanian Enterprise HOV.
HOV Business summary:
Hovnanian Enterprises Inc. designs, constructs, markets, and sells residential homes in the United States. It builds garden homes, townhomes, single family homes, mid and high rise luxury homes, estate homes, adult lifestyle communities, attached and detached homes, urban infill locations, and townhomes and condominiums. The company also provides mortgage loans and title insurance services.
HOV just signaled long. Also the trend indicator on the color strip below the chart went from red to green.

è It is time to dip my toe in HOV. If we get a pullback and a secondary buy signal on the HOV chart, I will add to my current position.


We can never be sure if a trade is going to be successful or not but aligning the market direction with the sector and then the stock is a good way to increase my chance of success.


Sunday, October 20, 2013

Debt Disaster Avoided – Market Signals Up 10/20/13

The Republicans caved in on a no win scenario they were pushing and the markets breathed a sigh of relief. The story here is how the bond markets showed little fear despite everything going to the last minute. It is somewhat depressing that our politicians shut the Government down and took us to the brink of a potentially disastrous scenario - one that we have never been on.


Still, my focus is the markets and I am surprised that the bond markets showed no fear at all. After the decision to kick the bucket a few months out, there was a strong move upwards. I was in Germany with not much of a chance to post given how busy my days were. Love the German food, the beer, the rail system and the showcase of plastics technology I saw there.

Here is a chart on SPY showing the strong up move. Same with IYR. Even TLT the long term Treasury bond fund has perked up. Time to stay long.


Sunday, October 6, 2013

401k Analysis during a Government Shutdown 10/5/13

With the Government shutdown, the markets gave been slowly gyrating downwards. It is behaving in a manner where it is reluctant to go down, and is waiting for an opportunity to surge back up; but that could be my overactive imagination. All that is evident is that the markets have now shown a down signal on the Dow Jones 30 and one of my systems has also shown down on the S&P500 (SPY). My very slow systems still has SPY pointing up; but this is a time for caution. The politicians in Washington are taking us to the brink. They cannot figure out how to reduce the deficit and one party seems determined to pull down achievements of the other. I think both parties are acting childish enough to make us default. This may cause serious volatility. It may affect bond funds as well as the dollar and I think we will need to stay nimble. For myself, I am going to continue to follow the technicals and lighten up.

My previous employer’s 401K points towards the momentum being with Artisan Mid-Cap Val Inst, Vanguard Explorer Admiral and Fidelity Growth Co.

My current employer’s fund choices points toward Royce Opportunity, NB MDCP Growth Trust, WFA SPL Midcap Value, and Fidelity Large Cap. I stay away from Royce only because it has high redemption fees if you get out early; but it is worth holding if you can stay in it for several months.


Sunday, September 29, 2013

Reading the Markets before a Government Shutdown? 9/29/13

This blog will be a quick read of the markets as I see it now. It is hard to separate what is happening in the political arena with the threat of a Government shut down looming in front of us in a few days. I have tried to remain a-political on this blog and will continue to do so. I will remain technical in my analysis.

First I look at the chart of SPY (S&P 500) which is an exchange traded fund ETF comprising of 500 of the largest companies in the US. It is a nice blend of sectors and remains my first choice on reading what the markets are doing. SPY is starting to degrade but still holding on and is above the blue Supertrend line. So the prognosis is UP.


Next I look at the technology sector with the Q’s (QQQ). This is a technology type ETF and it also is pointed UP. In fact I observe that the Q’s are stronger is demeanor than SPY. That translates to staying long in Growth funds in my 410K.


How is the Dow Jones 30 doing? The ETF is DIA and it consists of 30 stocks, all blue chips. DIA just gave a down DN signal… hmmm. Early signs of a market breakdown perhaps? Still early but the crack has to begin somewhere. The markets have not liked the position the Tea Party advocates are taking along with Republicans to shut the Government down unless the Democrats agree to defund or delay ACA or Obama Care as it is popularly called. The markets know that Democrats will not cave in to these delaying tactics, and that sets up the stage for uncertainty - a Federal Government Shutdown. Markets do not like uncertainty in the largest economy in the world.


How negative will that be? Each time this situation has happened in the past, this ill wind has blown away in 21 days or less and expectations are that the same will happen this time. If there is even a whiff of wind that this time will be different, then watch out. Most people expect an upward draft after this is all settled, and are therefore staying on board. The market drift downwards has been very mild still, but recency data says we have had 5 out of 6 days down.

Finally, it is time to look at the bond markets. A chart on the exchange traded fund TLT (Long term Treasury bond fund) shows what we would have expected, a slight perk upwards and an UP signal. How long will that last? As I have pointed out many times in my past blogs, no one including me knows. The talking heads and writers all theorize but I will not make decisions on those theories. TLT is still terribly weak and I do not expect it to fight such strong head winds and just climb away. But it will be worthwhile for me to buy some as a hedge against the markets going down right now.

Monday I will close my Blue Chips fund (based on the DIA down signal).
I will buy TLT in my R/IRA account as a hedge against the markets slowly winding downwards. I will hold on to my Mid-Cap and Growth funds as SPY and QQQ is still long and remain upward biased. Managing transitions is tricky but sitting doing nothing and watching our portfolios erode away is worse. 


Saturday, September 14, 2013

Gold’s Glitter Gone 9/14/13

Gold lost 4.7% for the week and gave a down signal. See chart below. It also dropped below the blue super-trend line which is another signal to shed holdings. I had been in DBC which is a commodity fund. My stop loss kicked in as DBC dropped below its super-trend line. Out of the trade for a small loss. No pain there. Just a slight irritation that the trade did not work out. Trading is a probability game. Nothing is certain. It is much like gambling except markets have gone up longer than gone down and using Technical Analysis (TA) we set up rules under which to buy and sell. TA essentially gives us courage to follow a system where losses can be minimized and gains allowed running.

Some people like the style of contrarian trading. They jump in when prices fall and will sometimes find themselves in the path of a falling knife. I know an associate who did exactly that with financials in 2008. I think that is a very risky way to trade. Almost a death wish. He pushed much of his R/IRA into financials thinking it would bounce back and I suppose he would have been right had he waited and seen a bottom first. But that is difficult to see but certainly easier with TA.

With Gold taking another Southward dive, what about Silver asks another friend?

I took a quick look at the charts on PAAS and SLV and can’t say that I find anything there that attracts me to buy into those other than a death wish. Better to wait for them to consolidate, see the selling tire and then go in when there is a clear uptrend. SLV is about 50% of its peak back in 2011. How low can it go? Nobody knows… Better to wait for these to get up over the blue super-trend lines and give entry signals..

Gold’s Glitter Gone? Maybe in the short term; but I cannot say for how long…. Its time to shine in the sun will come again. That’s when I want to buy…


Monday, September 9, 2013

Market Turns Positive 9/9/13

The threat of the US striking Syria has diminished and has caused the markets to be jubilant in the short term, or so it seems. Interestingly the Emerging markets have been moving up the fastest; China, India are all on high octane moving up. How quickly the grim news shifts and turns into positive energy.

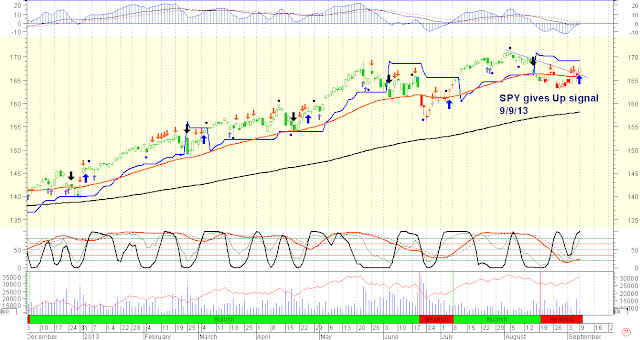
First taking a look at SPY, my system is showing an up signal although SPY has not yet crossed the super trend level shown by the blue horizontal line.


Next is a chart on EEM on Emerging markets and another chart on foreign markets VEU which I just entered today at market open, and also real state is perking despite all the bad vibes with interest rates creeping up. Time to get back in the murky waters.


Monday, September 2, 2013

401K Analysis -The Trend is your Friend.. until the End 9/2/13

It is Labor Day. US Open Tennis matches are washed out with rain. The market is a mixed bag. August was the worst down month since back in November 2012. I am reminded of the saying “The Trend is your Friend” and let me add… (..Until the End). So are we at the end of the uptrend?  I don’t think my predictive values are any better than anyone else’ as no one really knows. I see divergence between the last two tops of indicators and the last two tops on prices. This can stretch to three tops but every corresponding weaker top on the indicator means there is more weakness. In fact if this happens again, it would be an excellent time to buy put options as the market reaches its highs but the indicators do not. But overall we are not in a very weak stage yet. Certainly not like bond funds or emerging markets. I feel the market will snort its way back and put up a fight against the bears. I am personally taking a cautious approach in my portfolio. When I see a down signal on the SPY, I abandon the equity funds in my 401Ks. And right now I see a down signal in SPY and also on Bond funds, so I am out of those as well. Still, for the more aggressive investors, my monthly 401K analysis of where to put our money follows for my current and past employer.

In my current employer’s 401K funds, the top funds are Fidelity Blue Chip Growth, Fidelity Large Cap and WFA SPL MidCap VL. Royce is strong as well but the short term redemption fees keep me away. I am staying in all cash till SPY flags an Up signal or exceeds the value at which it gave a down signal. Sere SPY chart below as well as a chart on Fidelity Blue Chip Growth.

In my previous employer’s 401K, the top picks are Vanguard Explorer Admiral, Fidelity Growth Company and Artisan MidCap Value INSTL. Again, I am exited all because of the down signal on SPY. My position is one of caution but I will go back in once SPY changes direction. Maybe I will be get whipped a little but that is better than getting frozen like a deer in headlights and seeing my portfolio drop 20-30%. That is not going to happen for me, if I can help it.


Sunday, August 25, 2013

Indian Rupee Hits an All Time Low 8/25/13

The Indian Rupee hits its all time low last week around Rs65.56 to 1USD and then settled in at Rs63.30. Just a few years back it was in the Rs 45-50 range. Being a technical analyst and not a fundamental trader, it is easy to say I do not care why; but that is hard to say in this instance. When I left India many, many years back to come to the US to do graduate studies in Engineering I remember the Indian Rupee being around Rs 7-8? What has happened since? How is it that we can run up massive debt in the US and still have the INR declining against our currency?

India has only about 7 months of federal deposits and that number is shrinking due to the huge demand for oil and gold, both of which require US Dollars to purchase.
The Indian psyche has always favored Gold as the best hedge against all disturbances. When things go south, Indians buy Gold to hedge. Then there is the wedding seasons and families having to buy Gold as part of what they give the newly weds for their protection. India also imports 80% of their oil. Not a good situation. Add to that the US starting to look at reducing easing and even raising interest rates down the road, and we have a major problem.  

India has to borrow and invest into its infrastructure, and resolve how to reduce its oil dependency with a strong energy policy from the Government - using nuclear power, and more fuel efficient automobiles. More borrowing has the likelihood of weakening the currency and that is the fear we are seeing. Borrowing to buy gold and oil will not solve any of the structural problems and help investment, unless the weakened Rupee makes goods cheaper for foreign investments. In a democracy with political parties each wanting political power, it is much more difficult to steer the ship in the right direction, getting a majority support. It would be much easier in a country like China where the party could decree it.
I am a strong supporter of democratic principles, and I hope the country’s leaders are able to sort this out, because India has a lot to offer the world.

This week I saw continued strengthening in Gold and commodities. Not a huge amount but enough to where I am in DBC now, a commodity fund. The Nasdaq 100 has still not broken down, while SPY is showing some weakness but still hanging in. Emerging markets have shown a weakness and bond funds continue to decline.

Where will we go from here? I will follow my charts for direction…


Sunday, August 18, 2013

Gold is Glittering Again 8/17/13

When do I say a stock is going up? When the stock is making higher highs and higher lows, then we can say it is going up. When is a stock going down? When it makes lower lows and lower highs.

It is normal for traders to take profits when a stock gets overbought, which causes some selling leading to a small decline. Buyers come back after a decline and push the stock back up, achieving the higher high and higher low.  I believe GLD is starting to do that. It just crossed its previous high, and a likely scenario for me is now to wait for a pullback to enter GLD.

I use shorter cyclical indicators (see the black line in the lower chart pane) to tell me the extent of pullback. It is impossible to time it perfectly but after about 6 days of consolidation and pullback, the black line on my chart drops below 20 and that is usually a good place to look at re-entering. Using a buy stop order, above the previous day’s high is a nice way to enter. What that means is that I would place an order to buy GLD if the previous day’s high price is exceeded. That denotes a strengthening in the stock.

This is what I will now patiently wait for, and hope GLD does not run away on me!

Meanwhile I have had an exit signal on the Dow Jones 30 ETF known as DIA. This is a good time to cut back on positions and back off, and only re-enter when the down signal high is exceeded or when the system flashes a buy signal. Gold is often used as a hedge against market declines. Bond funds are clearly not working as a hedge against market declines anymore since interest rate hike fears are bringing bond funds down. I am completely out of bond funds and have been for a while and anyone reading my blogs can go back and see when I posted those exit signals….


Sunday, August 11, 2013

401K Monthly Analysis and Market Direction 8/11/13

The market direction remains long. See chart on SPY (S&P500) below. SPY is an ETF Exchange Traded Fund that can be traded like a stock. It includes all the stocks in the S&P500 and is a good proxy for market direction for me.

In my current employer’s 401K, best choices for this month are Fidelity Blue Chip Growth, WFA SPA Midcap VL, Fidelity Large Cap and Royce Opportunity. I stay away from Royce only because of the high redemption fess they charge unless you stay in the stock for a long time. It is volatile but also offers the fastest opportunity for gain (or loss for that matter).
In my previous employer’s 401K, the best selections for this month are Vanguard Explorer Admiral, Fidelity Growth Co. and Artisan Midcap VL Inst.

Included below are some charts on SPY as well as some of these top leading funds mentioned here.

At this stage, the conservative side of me is wandering towards articles about a market crash like in 1987. During that year the market also moved up for a long time before it crashed and dropped very rapidly. How can we protect against such a possibility?
One approach is based on options. Sell call spread options on SPY or the DIA (Dow Jones 30 ETF) and use the proceeds to buy put spreads on the same. This approach nets you less money than buying put options outright; but in case the market stays in a slight upwards slope, the account would not lose value from holding put options that might expire worthless.

Another approach is to buy the Volatility index like VXX and hold it for a while. If the market suddenly flares up due to say terrorist activities, then VXX will spike and help offset some losses. The only negative is that I see the VXX generally falling and finding a bottom is tricky and risky. The recent US embassy closings in many Middle East countries suggest that there is actionable evidence that some terrorist action is being planned against the US. I think I will go ahead and place some offsetting positions on Monday as outlined above.


Sunday, July 28, 2013

Processing Losses and Gold signal 7/27/13

Developing a strategy to overcome how to mentally deal with losses in trading is a key to being a successful trader/investor. We learn more from losing than winning, which is an unfortunate reality. In trading there is no such thing as certainty. I remember a PhD wealth manager, a gold bug, coming to our local AAII (American Association of Individual Investors) meetings and proudly claiming his wins in gold as he bought at $900 and it rose to $1200. Then he came back next year and repeated his happy performance when gold was up to $1600. He could do no wrong. He was a winner. He preached gold would hit $2200 because all the gold in the world would only fill a swimming pool. Next time he came, he was quite subdued. Markets had risen but gold had dropped to $1400. He had missed opportunities and he looked sick. He was buying gold miners then. Of course with gold much lower, I can imagine him now fighting to just hold on to his job. I expect we will not see him in a while at our meetings, unless he can process his losses. How can he do that?

Losses in the stock market make us feel like a loser. Missed opportunities also are treated as “losses” by traders.. I had a huge missed opportunity “loss” this year, and it still hurts. I listened to LW’s market forecast and ignored my own charts and systems.  LW would have been perfect if I had just turned his forecast upside down. Oh I get so mad with myself when I look at my trading systems signaling Up and I plan on Down, because LW said so. It was a huge missed opportunity that I treated as a ‘loss”. By focusing on what I learned from it, I was slowly able to overcome the feeling of being a loser and gain my confidence back. I have promised myself that I will no longer listen to Gurus who forecast long term direction. There are plenty of them around. I will only listen to the tunes my charts play and follow them.

My charts cannot predict how long any direction will last. For example a down signal can be short lived and turn right back into an up signal. Had I just stayed in it and ignored my down signal, I would do better. But then if I am longer following all my signals, what would dictate my buying and selling rule? I accept these small “losses” as part of the reality that the markets are not predicable. I don’t believe anyone who tries to tell you they can predict long term market direction as they are simply deranged. What I do know is a down signal is a sign of weakness, and I prefer to exit and not challenge that weakness, as the fall could be very substantial.

Looking at gold now, I see that it has taken a HUGE fall from its highs. It is now perking up although I do not expect it to start climbing for the stars. Investors who left and got out of gold have memory and it is likely that gold will try to build back a base before it climbs. This creates an opportunity. If I buy GLD on dips with a tight controlled loss, I could still profit. See chart of GLD below.  As long as it stays above my “floor” line of support, I will wait for a dip and get in. My sell point will be the support line. Profit will be taken on rises and signals from stochastics signaling overbought conditions. My expectation is sideways with a chance to make money on dips. If that is wrong, I will accept that as part of the frailties of trying to predict the market. Process a loss by asking what did we learn from the trade. Did we follow the trading plan? If so, then accept the loss as part of trading. Long term we will be winners, assuming we are using a good trading system.