Sunday, April 26, 2015

Ivy Portfolio Status 42615

My implementation of the Ivy Portfolio by Faber and Richardson is to use tactical asset management with each of the 5 domains to diversify in: Bond Funds (AGG, BND), Real Estate (IYR, VNQ), International Stock funds (EFA, VEU), US Stock Funds (SPY, VTI), Commodity funds (DBC, RJI). When my technicals give me an entry, I put money into one of the two funds in the domain that is signaling up. Right now, I am in SPY, VEU and DBC. See charts on those below. I am half strength in DBC because the fund is well below its 200 day moving average and will have to work its way back up. VEU is moving up the strongest, and I think that is because of the QE program ECB President Mario Draghi has Europe in.

In my last post I had mentioned that MSFT needed to break out of its downward pattern… and it did and gave a buy signal before earnings announcement. Unfortunately MSFT is not something I invest in. It behaved very well and gave an up signal prior to the earnings announcement and then jumped up…. there were investors already betting on the up move before the earnings announcement. Could it be that they knew the good news coming or was that just chart optimism from the double bottom?
See the refreshed MSFT chart below.


MSFT chart below:


Saturday, April 11, 2015

Is it time to buy MSFT? 4/11/15

A friend of mine asked me if it was a good time to buy Microsoft now as it had come down from its high. Show below is daily chart on MSFT.

MSFT has been in a downward signal since the end of last year. It is still in the throes of multi-month pullback - see the blue line sloping down touching the local highs and being unable to cross the trend line... I would wait for that trend line to be broken and an uptrend to be established before going back in. In an uptrend the 50 day ema should be above the 200 day ema ... It is currently opposite of that. If you are a contrarian or aggressive investor then you could enter... but I am not.
So far the price is holding above its support which is around $38-$40. It may start moving up or could break down below $38. One could take a chance and buy keeping the $38-39 as a stop loss level depending on appetite for loss.


I prefer to trade the uptrend by buying on dips ... for example you will see on the chart larger arrows which give the primary trend direction and small arrows which are the contrarian signals suggesting when you can buy on the dip if the larger arrow is also pointing up. Earnings season has begun. Perhaps the market is waiting for earnings news to decide which way to turn.


Saturday, April 4, 2015

401K Monthly Analysis - The Trend Pauses

The S&P 500 (SPY) remains in an uptrend but short term in a pull back. As one of my IIT classmates and expert market Guru from India, Deepak Mohoni states “When you buy on pull backs you can only be wrong one time”.  There is a saying that “the trend is your friend, until the end”… and right now we are in a pull back.
My chart on SPY shows an exit long signal from 2/2/15 and I am taking a break from participating in 401K funds. See chart on SPY below. I am conservative as far as investing is concerned and will give up upside gains to avoid large losses. I show long signals on IYR which is a Real Estate ETF and also in VEU which is a Global fund excluding the US. TLT, Long Term Treasury fund also shows an up signal. I am long these funds.

In my current employer’s 401K funds, the top choices are Fidelity Growth Strategies, Fidelity Blue Chip fund and Fidelity Div Intl fund. Royce Opportunities is also showing some recovery from its large drop. Attached is a chart on Fidelity Growth Strategies. Since SPY is showing an exit long, I am out of my 401K.

In my past employer’s 401K fund, the top choices are Cohen & Steers Real Estate fund, Fidelity Spartan Extended Market Index and Fidelity Mt. Vernon Growth fund.


Some market pundits are trying to stay ahead of the market by calling for a potential drop in markets for 2015 since the market has been plodding upwards for 6 years. SPY or the S&P500 has never gone into a major decline without the 50 day exponential moving average (ema) dropping below the 200 day ema. From the chart on SPY I see that the red line (50 day ema) is still above the black line (200 day ema). I think there is still plenty of time before we see a major decline … at least 3-6 months. I try not to get too ahead of myself with long predictions as no one really knows. However based on the past, I would say we have time… and yet I am exited on my 401K… I am conservative, no doubt. I still follow the Ivy Portfolio signals and right now, it has me long in IYR, VEU and even DBC. The last one is a commodity fund and it has dropped to half its value… and I just entered it end of last week. It looks like it made a double bottom. If the world can reach an agreement with Iran on their nuclear program, then oil will flow freely from Iran into the markets and we could see past support for oil breaking and oil going much lower. There is some thought that there will be a greater need for oil tanker storage. Stocks like NAT (Nordic American Tankers) may be a better investment as oil producers produce more and more oil… 


Friday, March 6, 2015

Market Topping? 3/6/15

The US markets have been on a tear for over 5 years now… and we wish it would stay this way for another 5. The latest jobs data shows unemployment at 5.5%, a long way down from the 10% we were at back in 2008. QE has worked to boost the economy and low interest rates have allowed the stock markets to flourish. But with the 5.5% unemployment the market worries that the Fed will start raising interest rates. Higher interest rates may slow the economy… and therefore the markets took a breather.

When I look at the chart of the Dow Jones 30 as depicted by the Exchange Traded Fund (ETF) known as DIA, I see a down signal. This down signal is still under the background of a strong up trend. Prices are still comfortably above the 200 day moving average shown as a dark black line on the chart for DIA below. Almost all the market move up this year has been nullified after the steep drop today. Also note the trend line violated on the OBV (On Balance Volume) panel at the bottom of the DIA chart. I have found that to be something to keep a watch on for shifts in trend. For now I am expecting the market to continue to show some weakness. I am considering selling some call spreads on DIA... 

I have to be wary as we are still in an uptrend.
One ETF that I am in is TBF. It is an Inverse Bond fund. See chart below on TBF and the long entry signal it flagged in green. I believe that trading TBF or TLT depending on which one is giving a buy signal allows me to trade a bond fund almost all the time… the chart on TLT has a down signal and is starting to get to being oversold… that means it is soon going to take a small bounce before it takes another drop.

A trade I just closed out today on market open was the trade on TAN (solar ETF). I review charts at the end of day and placed the trade to close my position next day market open so that it will close out without my having to watch it. TAN has had a very healthy bounce thanks to a Chinese Solar company that has moved up over 40%. It is a significant holding within TAN, or so I have read; but TAN is extremely oversold… see the pink balloons above the price and it was time for me to bank profits. I like to call it quits when I see two pink balloons above the price… as TAN is very overbought at that stage and traders will take profits (like me). I am mostly cash now…


Chart on DIA


Chart on TBF


Chart on TLT


Chart on TAN

Sunday, March 1, 2015

401K Monthly Analysis –Market Update 22815

Markets Analysis: The markets have continued to move up in a low interest rate environment and now fueled by the QE coming from Europe. My stock chart on SPY (S&P 500) remains mysteriously pointing towards an exit long signal while the markets have moved to new highs… The chart on QQQ shows an Up signal. See charts below.

Looking at my past employer’s 401K the top performers that the momentum method favors are Mt Vernon Growth, Cohen & Steers Realty and Vanguard Instl Index funds. Next choice would be Artisan MidCap FD.


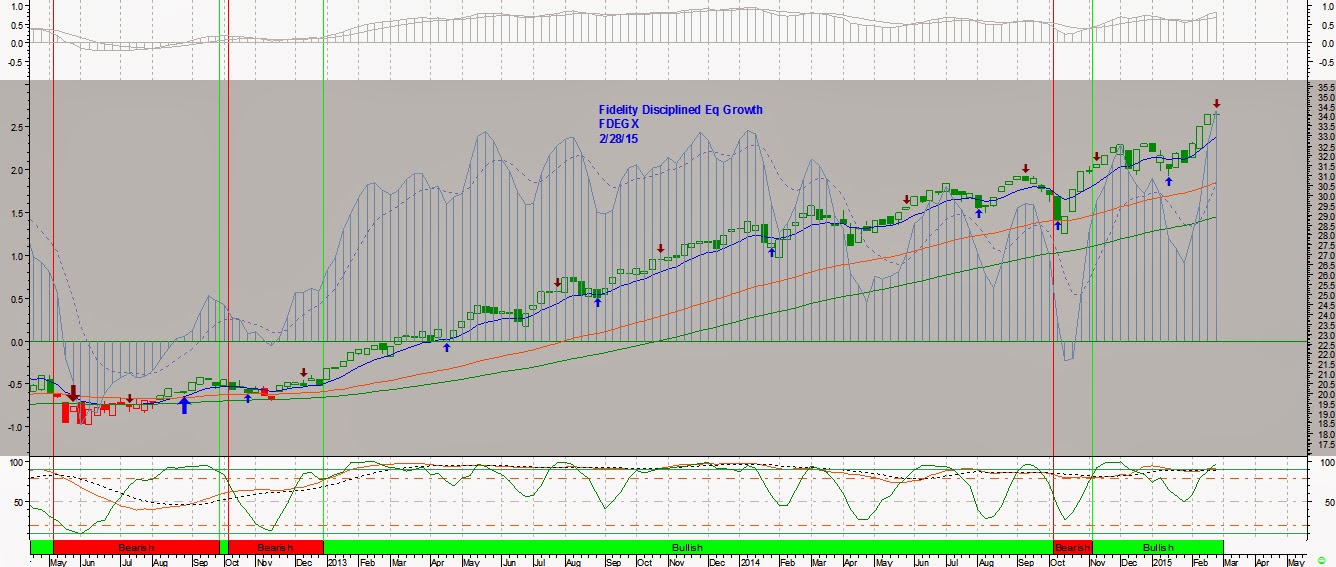
In my previous employers 401K funds the high performers are Fidelity Growth Strategies, Spartan 500 Fund and Fidelity Fund. Fidelity Div Intl has also broken out of its downward funk and is the 4th choice. The chart below on Fidelity Growth Strategies shows a short term sell signal based on being overbought. It has had a nice move up. The bottom of the barrel is Royce Opportunities…which has not done well and is still in a consolidation downwards... 


Sunday, February 1, 2015

Developing an Automated Trading System – 2/1/15

It has been my dream to have a money tree. It would take some nurturing, adding nutrients and water but US dollar notes would sprout from the tree. Alright, I know that is not in the likely realm of occurrences! My proxy dream is to be able to develop an automated trading system. I would be trading e-mini Nasdaq 100 futures (or oil futures) on a very short time frame and preferably either just the morning or the afternoon. The computer would have my algorithm saved in its brain. It would include a time solver so that at the start time it would wake up and look for signals and at the end of the session it would close any open trades... On receiving a buy signal the computer would automatically place the trade. A short time later after it reached its profit objectives it would take profit. All along the process, it would also have exit plan so that if the futures behaved differently from what was expected, it would exit the trade for a small loss and wait for the next signal.
Till recently, I did not think I could do that as I am not a C++ code developer. I think I am pretty knowledgeable on technical analysis but converting that knowledge to an algorithm and then back test it seemed impossible with my limited capabilities (COBOL, Basic and Fortran) in programming. But that was till 2 months back when I ran across Sharkindicators Bloodhound software. 

See link for its home.        http://www.sharkindicators.com/
 Quick Start tutorial          https://www.youtube.com/watch?v=0viC-gSQIw8

With this software one can take technical indicators, even with multi-time frames and using visual drop and drag boxes that have my indicators and logic, combined with and/or and many other node features create quite sophisticated trading systems. Additionally Bloodhound is written for ninjatrader software which can go to any of several brokers who specialize in low cost futures trading, placing buy and sell trades. And did I say that short term futures trades are treated as long term capital gains for taxation? Go figure.


So here is a chart of a quick system I was back testing. It uses MACD’s sweet spot when it breaks out close to 0 and a medium speed EMA (exponential moving average) like 20 to decide which direction it will trade and when. The chart shown below is a 2 minute chart of NQ. I started practicing back testing with it using 1 minute past data from last year. I am testing it during the first 3 months of actual data from 2014 and where the results look profitable, I tested it again for the next 3 months. I changed the Take-profit level from 6 ticks to 48 ticks in 6 tick increments. Each tick is worth $20 in profit on one contract of /NQ. The results show that keeping a take profit in the range of 24 – 48 ticks is much better than keeping it tight at 6-12 ticks. Small stop loss values are not very effective with this system as it is not super well timed for entry. I may consider adding stochastics to it and improve timing. I can enter only when stochastics is below 80 or 90, a typically classic signal to enter on weakness but in the direction of the long trend. I left the stop loss as unspecified and allowed the system to exit when the opposite signal was generated.
The beauty of the software is that I can take these systems with all its variables through its paces and better understand the hard and soft regions of profit and losses. This trading system is certainly not always profitable but it has promise. I have many ideas for trading and this software has given me the capability to start with taking a few simpler systems through its paces before I get into ones that are more complex. I purchased Sharkindicator’s Bloodhound Ultimate version which sells for $495 and also the BacktestRenko option which is additional.

I look forward to spending many hours listening to Youtube training videos by Jeremy Tang the creator of the software and Zac, one of their experts.  I can fine tune and testing many ideas using technical analysis coupled with logic algorithms to come up with my money tree. I don’t expect any if this to happen quickly and expect many hours on weekends to make this work. But it will be worth it….


Saturday, January 17, 2015

Swiss Surprise 1/17/15

Earlier this week the Swiss National Bank (SNB) scrapped its three-year-old cap on the franc against the euro. The announcement came as a huge surprise to the currency markets and within minutes the Swiss franc jumped 30% against the euro and the US dollar. In the world of Forex currency trading, where Billions are traded and retail traders can take advantage of high leverage, a 30% move meant those with short positions on the Swiss franc had their accounts wiped out in minutes. Liquidity completely disappeared. There were no takers on the opposite side. Those with stop losses found that brokerages had shut down trading. Stop losses mean nothing when trading is stopped. 

Retail traders were snuffed out. Understand that with a $10,000 account you could be controlling $200,000 in currency – that is leverage. When there is a 30% move the other way against you in such a short time, it creates a $60,000 loss. The small $10,000 account is wiped out. Then the FX broker is scrambling to shut down his position while there is no liquidity. Major FX trading houses like Alpari (UK) failed… wiped out. FXCM in the US was chest deep in debt and had to have money poured into them from outside. A large Everest capital hedge fund has closed. The fund had been betting that the Swiss franc would decline. Many will ask, why were they not truly hedged... hedging costs money. In the chase for larger returns, we leave ourselves open to more risk. While shorting (selling) the Swiss franc against the USD or euro, one could buy calls out of the money and hedge one's position, reducing risk. Most don't.  
Looking at the chart below on FXF we can see that the technicals were pointing downward for the Swiss franc when the announcement came. However after the announcement by the SNB and FXF spiked. FXF is not a leveraged instrument but FX currency trading is and so are futures.


Some people came out like bandits. Maybe rich Russians who had moved money out of the ruble and stuck them in Swiss francs in Swiss banks…  Swiss chocolates, Swiss vacations and Swiss cheese are now a lot more expensive… all this makes me realize the risks in leveraging. While returns can be quick and fast, a major black swan event will wipe out accounts, brokerages and create massive losses for the major banks and it did. I will always remember the ugly side of leveraging…and hope it never gets me...these are the dangers of trading FX and futures markets... risk and reward are inexorably tied together.. just different ends of the same spectrum.