Monday, September 5, 2016

401K Monthly Analysis – A Down Signal? 9316

My daily SPY analysis shows a down signal. Chart attached. This is using a custom trading system generated by ICE software for Metastock and using my preferences to customize it. The signal is leading and depends on the indicators selected. All trend following systems are lagging price. If we have profited from the last move up in the markets, this may be a time to pare down and get protective if you are cautious like me.

With my previous employer’s 401K funds, the top funds from the monthly analysis are Royce Opportunity, Fidelity Equity Income, Fidelity Blue Chip Growth and Spartan 500 fund (same as SPY). Royce is actually at the top but it is very volatile, and also has a short term trading redemption fee in case we want to get out within a month. Royce has recovered from its low of $8.46 price to $11.55 now. Considering it was at over $16, it moves around a lot. It is better to invest in Royce when all the stars are aligned as it can drop quickly. The FGOVX that I am still in is going nowhere. Still has an up signal on the weekly chart.  
I have not started analyzing my current employer’s 401K funds but I will soon as I am aggressively saving there…

I have put in a trade on ITRI at the recent secondary buy signal. Also closed out a nice trade on SHOP in my R/IRA. Credit goes to Motley Fool for the pick...I hold TLT as a hedge against these trades. Currently I am in FB and MTCH, social media stocks. I have also started taking some longer term put positions on the Q’s in case the market tanks in the Fall before the elections.


Sunday, August 7, 2016

401K Monthly Analysis - Higher 8716

The market continues to ignore any disappointing news and head on higher. Brexit gave us a reason to pause but we are over that it seems. SPY is pointed up. So is QQQ and the Diamonds (DIA) Dow Jones 30. See charts below on SPY and QQQ. The market is not concerned with the US elections. I suspect that is because the outcome is likely less uncertain based on recent polling.

My previous employer’s monthly analysis shows that the top funds to be in are Royce Opportunities, Fidelity Blue Chip Fund, Spartan 500 and Fidelity Income fund. Royce is a very volatile fund and has a short term redemption fee charged if you get it and get out in a month. It is fund that you have to commit leaving money into.

I am ready to start my next experiment in trading. I have been trialing my automated trading program (Bandit) with real-time data and simulation money on a VPS and the performance over a year has been very positive. It is now time to turn on the real thing. I will not be looking over my shoulder at it… it will be running on its own with a stop loss and take profit levels for about 2 ½ hours each day in the morning trading Nasdaq futures… Let us see how well real-time performance does vs forward simulation. 


Monday, July 4, 2016

401K Monthly Analysis – Summer Rally or Not 7/4/16

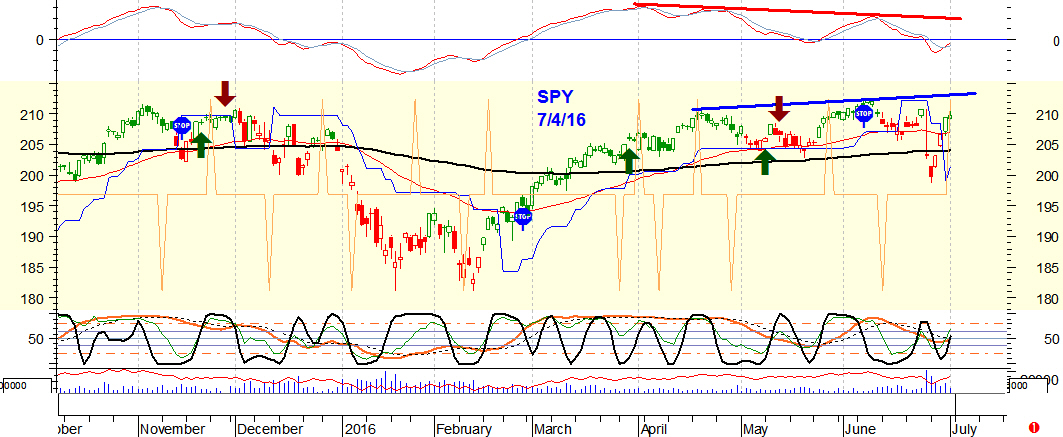
My daily SPY analysis shows an exit down signal; which I interpret as Up; but the market has been trading sideways for a while. The resolution to the sideways move will either be up or down. With Brexit, we saw volatility spike and then quietly ebb away. Fade the down move the market said. So here we are again at a sideways situation. What can I squeeze out of the charts for clues? And what are they telling us right now?

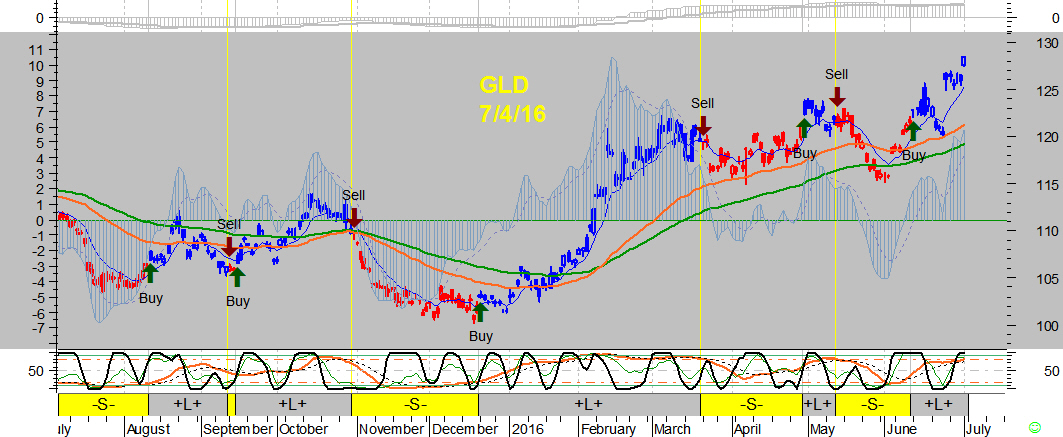
Gold has been steadily moving up. I have to believe that based on the chart for GLD shown below. NUGT, the Gold Miner’s ETF has gone nuts. Over the last few months it has moved up from the 20s to 144. Talk about a big move…  And the bond funds have also gone up. See chart for TLT, 20 year Treasury bond fund ETF, below. And stocks? Well they are also holding their own. But something has to give. We can’t have Gold, bond funds and stock funds all harmoniously going up. They don’t like each other…Which will give ground?

Looking at the chart for SPY I see a slight divergence between the indicator peaks, (red line) and the SPY’s peaks (blue line). SPY has gone up but not convincingly. So here I go again. I will be cautious and stay on the side lines. If we breakout then the market will rip and I will be crying about missing the Summer rally for sure!

With my previous employer’s 401K funds, the top funds from the monthly analysis are Spartan 500 fund (same as SPY), Fidelity Equity Income and Fidelity Growth Strategies. Royce is actually at the top but it is very volatile, and also has a short term trading redemption fee in case I want to get out within a month.  

I have not started downloading and analyzing my current employer’s 401K funds. But I will next month. I am putting as much money as I can into my 401K every month; all into a docile fund. 


Sunday, June 5, 2016

401K Monthly Analysis – SPY Conflicts 6316

The S&P500 (SPY) points down. Attached below is a chart of SPY showing the down signal. My slower monthly 401K system has switched from Bond funds like Fidelity Govt fund and is showing entries into equity. What do I do? I decided a while back that I will follow my overall master switch (SPY) and use that to override any 401K picks in the equity arena. That means I will exit my Fidelity Govt funds and stay in money market for now.

Going into my previous company’s 401K the top funds selected by my monthly analysis are Royce Opportunity, Fidelity Equity Income and Spartan 500 fund, which are all equity type funds. But since my choices are governed by the SPY exit signal, I am just going to remain in a money market fund for now.

I am invested in a couple of equities, oil and another ETF. I will follow the technical signals on those separately. When there is an exit signal on oil, I will get out. I have also seen an entry signal in EEM Emerging Markets and IIF India Fund. I have taken a small position in the India fund. The overall equity markets seems to want to go up. But it is burdened by the possibility of a slowdown and soft earnings. Technical signals is the beacon that I follow.


Monday, May 30, 2016

A Case for Oil vs Gold 52916

Which is stronger right now? Oil or Gold?
I have put some money in Oil. Not Gold. Looking at the charts, I see a down signal on GLD. Also Gold Miners ETF NUGT has taken a big hit lately dropping from over $100 to $70. Being a leveraged ETF it moves quickly, up or down.

The ETF I have purchased for oil is USL. Currently it has worked off a bottom and has slowly been on an incline upwards. See chart below on USL. Fundamentalists will provide the reasons why. We have both a major and minor signal pointing up. Summer months and more travel and higher oil consumption? If the market’s mood changes I will be quick to exit. I would rather see my account creep upwards at a slow pace than hold and pray over the next 5 years while it takes a beating. That is my conservative mind set.

OIL (USL) CHART


 GOLD (GLD) CHART


Additionally I have a buy signal on QQQ and DIA. That means a buy signal on the Nasdaq 100 ETF and the Dow Jones 30 ETF. My cautious play with that is to sell some QQQ vertical put spreads with a delta of around 40 and with a near month expiration. My plan is to hold it for a couple more weeks with the expectations that it will go sideways or up, and I would keep the credit premium. The max gain and loss on this transaction is capped. It is also a cautious play.

QQQ CHART


I am also seeing a buy signal on EEM (Emerging Markets ETF) and on IIF, the India Fund. Think I will put in for a small buy on the IIF. It can move up quite rapidly. But if it goes down, then I will follow the exit signal and take a small loss. It seems a safer play to buy IIF with a corresponding buy signal on EEM… no guarantees though!

Sunday, May 8, 2016

401K Monthly Analysis – Sell in May and… 5/8/16

It is May again and the old proverb “Sell in May and Go Away” comes to mind. But will that be the right move?

When I did my monthly analysis on my previous employer’s 401K where I have funds in, the top choice was to stay in Fidelity Govt Income Fund. I am currently 20% invested in that and rest is money market. I am cautious on my investing and see no point in taking unnecessary risks right now. The market is pretty murky and one cannot clearly see the bottom. See my chart below on DIA (Dow Jones 30 ETF). It shows a divergence in price versus the indicator above it.  See the orange line sloping down off the indicator’s last two peaks while the green line off the price peaks is sloping upwards. That suggests that although price is rising, this is not a strong move.


The latest jobs report was tepid. To me that is actually good. I would rather see slow growth than a rapid one and us reaching full employment rapidly and interest rates rising. As it is we are at 5% unemployment which is historically a low number. It is certainly a lot lower than 7 years back when we had 10% unemployment and jobs were tanking. China showed lower exports and imports - shrinking. And my emerging markets chart (EEM) has fired off a down signal. See chart below.


The US dollar actually dropped below its support level. And what has been rising lately is Gold. See chart below on GLD. What has been rising very, very rapidly is the 3xleveraged Gold Miners ETF fund… NUGT. I will write about that in my next blog.
Meanwhile I will look at cautious trades such as selling vertical call spreads on market ETFs such as DIA..


Sunday, April 10, 2016

401 Monthly Analysis – Confusion! 4816

The monthly analysis on my two 401K funds continues to show a cautionary outlook as it abandons stock funds. Meanwhile my ICE system on SPY shows an up signal which suggests an up signal on stock funds. This is a cautionary tale as the monthly analysis has not turned to stock funds yet. Investing in bond funds usually means that we are expecting bonds to rise as investors take flight from stocks.

I have just started putting money into my new current company’s 401K and have not yet started any analysis. Based on my previous company’s 401K monthly analysis the Fidelity GOVT Income Fund is at the top of the list. I will increase my holdings in that fund. In a past 401K company holdings I have, the PIMCO GL BD ADM fund and PIMCO REAL RETN ADMN funds are at the top. They are both bond funds. The Realty fund is next in line and has also shown strength.


Confusing tale on the tape = Caution = Stay in Bond funds…