Sunday, September 29, 2013

Reading the Markets before a Government Shutdown? 9/29/13

This blog will be a quick read of the markets as I see it now. It is hard to separate what is happening in the political arena with the threat of a Government shut down looming in front of us in a few days. I have tried to remain a-political on this blog and will continue to do so. I will remain technical in my analysis.

First I look at the chart of SPY (S&P 500) which is an exchange traded fund ETF comprising of 500 of the largest companies in the US. It is a nice blend of sectors and remains my first choice on reading what the markets are doing. SPY is starting to degrade but still holding on and is above the blue Supertrend line. So the prognosis is UP.


Next I look at the technology sector with the Q’s (QQQ). This is a technology type ETF and it also is pointed UP. In fact I observe that the Q’s are stronger is demeanor than SPY. That translates to staying long in Growth funds in my 410K.


How is the Dow Jones 30 doing? The ETF is DIA and it consists of 30 stocks, all blue chips. DIA just gave a down DN signal… hmmm. Early signs of a market breakdown perhaps? Still early but the crack has to begin somewhere. The markets have not liked the position the Tea Party advocates are taking along with Republicans to shut the Government down unless the Democrats agree to defund or delay ACA or Obama Care as it is popularly called. The markets know that Democrats will not cave in to these delaying tactics, and that sets up the stage for uncertainty - a Federal Government Shutdown. Markets do not like uncertainty in the largest economy in the world.


How negative will that be? Each time this situation has happened in the past, this ill wind has blown away in 21 days or less and expectations are that the same will happen this time. If there is even a whiff of wind that this time will be different, then watch out. Most people expect an upward draft after this is all settled, and are therefore staying on board. The market drift downwards has been very mild still, but recency data says we have had 5 out of 6 days down.

Finally, it is time to look at the bond markets. A chart on the exchange traded fund TLT (Long term Treasury bond fund) shows what we would have expected, a slight perk upwards and an UP signal. How long will that last? As I have pointed out many times in my past blogs, no one including me knows. The talking heads and writers all theorize but I will not make decisions on those theories. TLT is still terribly weak and I do not expect it to fight such strong head winds and just climb away. But it will be worthwhile for me to buy some as a hedge against the markets going down right now.

Monday I will close my Blue Chips fund (based on the DIA down signal).
I will buy TLT in my R/IRA account as a hedge against the markets slowly winding downwards. I will hold on to my Mid-Cap and Growth funds as SPY and QQQ is still long and remain upward biased. Managing transitions is tricky but sitting doing nothing and watching our portfolios erode away is worse. 


Saturday, September 14, 2013

Gold’s Glitter Gone 9/14/13

Gold lost 4.7% for the week and gave a down signal. See chart below. It also dropped below the blue super-trend line which is another signal to shed holdings. I had been in DBC which is a commodity fund. My stop loss kicked in as DBC dropped below its super-trend line. Out of the trade for a small loss. No pain there. Just a slight irritation that the trade did not work out. Trading is a probability game. Nothing is certain. It is much like gambling except markets have gone up longer than gone down and using Technical Analysis (TA) we set up rules under which to buy and sell. TA essentially gives us courage to follow a system where losses can be minimized and gains allowed running.

Some people like the style of contrarian trading. They jump in when prices fall and will sometimes find themselves in the path of a falling knife. I know an associate who did exactly that with financials in 2008. I think that is a very risky way to trade. Almost a death wish. He pushed much of his R/IRA into financials thinking it would bounce back and I suppose he would have been right had he waited and seen a bottom first. But that is difficult to see but certainly easier with TA.

With Gold taking another Southward dive, what about Silver asks another friend?

I took a quick look at the charts on PAAS and SLV and can’t say that I find anything there that attracts me to buy into those other than a death wish. Better to wait for them to consolidate, see the selling tire and then go in when there is a clear uptrend. SLV is about 50% of its peak back in 2011. How low can it go? Nobody knows… Better to wait for these to get up over the blue super-trend lines and give entry signals..

Gold’s Glitter Gone? Maybe in the short term; but I cannot say for how long…. Its time to shine in the sun will come again. That’s when I want to buy…


Monday, September 9, 2013

Market Turns Positive 9/9/13

The threat of the US striking Syria has diminished and has caused the markets to be jubilant in the short term, or so it seems. Interestingly the Emerging markets have been moving up the fastest; China, India are all on high octane moving up. How quickly the grim news shifts and turns into positive energy.

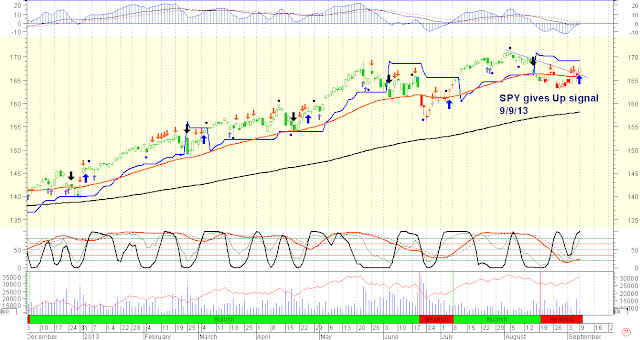
First taking a look at SPY, my system is showing an up signal although SPY has not yet crossed the super trend level shown by the blue horizontal line.


Next is a chart on EEM on Emerging markets and another chart on foreign markets VEU which I just entered today at market open, and also real state is perking despite all the bad vibes with interest rates creeping up. Time to get back in the murky waters.


Monday, September 2, 2013

401K Analysis -The Trend is your Friend.. until the End 9/2/13

It is Labor Day. US Open Tennis matches are washed out with rain. The market is a mixed bag. August was the worst down month since back in November 2012. I am reminded of the saying “The Trend is your Friend” and let me add… (..Until the End). So are we at the end of the uptrend?  I don’t think my predictive values are any better than anyone else’ as no one really knows. I see divergence between the last two tops of indicators and the last two tops on prices. This can stretch to three tops but every corresponding weaker top on the indicator means there is more weakness. In fact if this happens again, it would be an excellent time to buy put options as the market reaches its highs but the indicators do not. But overall we are not in a very weak stage yet. Certainly not like bond funds or emerging markets. I feel the market will snort its way back and put up a fight against the bears. I am personally taking a cautious approach in my portfolio. When I see a down signal on the SPY, I abandon the equity funds in my 401Ks. And right now I see a down signal in SPY and also on Bond funds, so I am out of those as well. Still, for the more aggressive investors, my monthly 401K analysis of where to put our money follows for my current and past employer.

In my current employer’s 401K funds, the top funds are Fidelity Blue Chip Growth, Fidelity Large Cap and WFA SPL MidCap VL. Royce is strong as well but the short term redemption fees keep me away. I am staying in all cash till SPY flags an Up signal or exceeds the value at which it gave a down signal. Sere SPY chart below as well as a chart on Fidelity Blue Chip Growth.

In my previous employer’s 401K, the top picks are Vanguard Explorer Admiral, Fidelity Growth Company and Artisan MidCap Value INSTL. Again, I am exited all because of the down signal on SPY. My position is one of caution but I will go back in once SPY changes direction. Maybe I will be get whipped a little but that is better than getting frozen like a deer in headlights and seeing my portfolio drop 20-30%. That is not going to happen for me, if I can help it.